小型ドローン市場レポート:2026-2036年
Small Drones Market Report 2026-2036
概要
Visiongainは、新たなレポート「小型ドローン市場レポート:2026-2036年」を発表しました。本レポートでは、市場規模、成長要因、競合状況、および主要なドローン用途、技術、エンドユーザー別の... もっと見る
※上記価格は部署ライセンス(Departmental licence)価格です。
その他の価格についてはデータリソースまでお問合せください。
日本語のページは自動翻訳を利用し作成しています。
実際のレポートは英文のみでご納品いたします。

|

|
サマリー
概要
Visiongainは、新たなレポート「小型ドローン市場レポート:2026-2036年」を発表しました。本レポートでは、市場規模、成長要因、競合状況、および主要なドローン用途、技術、エンドユーザー別の収益予測を含む、世界市場の包括的な分析を提供しています。
世界の小型ドローン市場は、2026年の48億米ドルから2036年までに137億米ドルへと拡大し、年平均成長率(CAGR)は11.1%になると予測されています。これは、防衛、商業、公共安全の各セクターにおける需要の急増によるもので、自律性、撮像システム、データ分析の進歩により、ドローンがますます複雑な任務を遂行できるようになっているためです。
市場拡大を牽引する技術革新
自律飛行システム、センサー統合、人工知能(AI)における急速な技術進歩が、小型ドローン業界の競争環境を一新しています。高度なナビゲーションシステム、障害物回避技術、自動飛行管理の継続的な開発により、ドローンは複雑な運用環境においても、より高い自律性と信頼性を持って運用できるようになっています。
また、人工知能を活用した分析プラットフォームは、ドローンが生成するデータの処理および活用方法を変革しつつあります。機械学習システムは、自動画像認識、物体検知、インフラ分析にますます活用されており、ドローンは単に空撮画像を収集するだけでなく、実用的な知見を提供できるようになっています。これらの機能は、業務効率と意思決定の改善を求める防衛機関および民間産業双方から強い関心を集めています。
また、エネルギー、農業、物流、インフラ管理などの業界全体において、新たなドローン用途の開発を後押しする多額の投資も行われています。ドローンのハードウェア性能が向上し、ソフトウェアプラットフォームが高度化するにつれ、日常的な業務ワークフローへのドローンの統合は、複数のセクターにわたり拡大していくと予想されます。
貿易とサプライチェーンの動向
半導体、センサー、撮像システム、バッテリー技術などの重要部品へのアクセスをドローンメーカーが管理する中、サプライチェーンは変化しつつあります。これらの部品は多くの場合、世界中から調達されるため、生産は供給状況、コスト、調達戦略の変化の影響を受けやすくなっています。
投入コストの上昇と供給制約は、業界全体の製造経済性と調達判断に影響を及ぼしています。競争の激しい市場で事業を展開する企業は、価格圧力と、性能および信頼性を維持する必要性とのバランスを取っています。
これに対応し、メーカー各社はサプライチェーンの多様化、地域生産能力への投資、サプライヤーネットワークの強化を通じて、レジリエンス(回復力)の向上を図っている。こうした調整により、世界のドローン市場全体において、生産モデル、コスト構造、長期的な調達戦略が再構築されると予想される。
本レポートで回答する主な質問
-
2036年までの小型ドローン市場の予測規模は?
-
どの用途セグメントが最も高い成長率を示すか?
-
自律技術はドローンの機能の進化にどのような影響を与えるか?
-
予測期間中、どの地域および国内市場が導入を牽引するか?
-
米国の貿易関税は、ドローンのサプライチェーンや製造戦略にどのような影響を与えるか?
-
主要企業はどの企業であり、その競争上の地位はどのように変化していくでしょうか?
レポートの範囲とデータ対象
-
世界の小型ドローン市場に関する包括的な分析
-
2036年までの売上高予測
-
複数の技術および用途カテゴリーにわたるセグメントレベルのモデリング
-
地域別および国別の市場分析
-
主要ドローンメーカーおよび技術プロバイダーの競合プロファイリング
市場の動向、成長要因、競争環境、技術開発、および戦略的な業界トレンドを網羅した定量的予測と定性的分析を含みます。
セグメンテーションの枠組み
推進方式別
プラットフォーム別
-
回転翼(マルチローター)
-
固定翼
-
ハイブリッドVTOL
最大離陸重量(MTOW)別
-
250 g未満
-
250 g~2 kg
-
2~10 kg
-
10~25 kg
用途別
-
セキュリティおよび監視(ISR)
-
航空撮影・測量
-
点検・監視
-
農業
-
その他の用途
ペイロードタイプ別
-
光学ペイロード
-
LiDARペイロード
-
SIGINT / EWペイロード
-
熱画像ペイロード
-
マルチスペクトルペイロード
-
ハイパースペクトルペイロード
地理的カバレッジ
世界市場全体および各セグメントの収益予測に加え、以下の5つの地域および20の主要国市場に関する収益予測も掲載されています:
北米
欧州
-
ドイツ
-
イギリス
-
フランス
-
イタリア
-
スペイン
-
その他の欧州地域
アジア太平洋
-
日本
-
中国
-
インド
-
オーストラリア
-
韓国
-
その他のアジア太平洋地域
ラテンアメリカ
中東・アフリカ
企業情報
競合分析では、以下を含む20社以上の主要企業を網羅しています:
-
AeroVironment
-
Asteria Aerospace
-
Autel Robotics
-
BAE Systems plc
-
Delair
-
DJI (Da-Jiang Innovations)
-
Edge Autonomy
-
EHang
-
Elbit Systems
-
General Atomics Aeronautical Systems
-
ideaForge
-
Israel Aerospace Industries
-
Lockheed Martin
-
Northrop Grumman
-
Parrot
-
Quantum-Systems
-
Rheinmetall
-
Saab AB
-
Skydio
-
Teledyne FLIR
-
Thales Group
-
UVify
-
Uvision Air Ltd.
-
Wingtra
-
Yuneec
各プロファイルでは、能力、パイプラインにおける位置付け、戦略的展開、および商業的見通しを評価しています。
「小型ドローン市場:2026年-2036年」レポートは、どのように役立つでしょうか?
要約すると、480ページ以上にわたる本レポートでは、以下の知見を提供します:
-
小型ドローン市場:2026年から2036年における2036年までの売上高予測。推進方式、プラットフォーム、最大離陸重量(MTOW)、用途、ペイロードの種類ごとの予測を、グローバルおよび地域レベルで提示。業界の展望を把握し、投資と収益において最も有望な市場を見極めることができます。
-
5つの地域および25の主要国市場における2036年までの売上高予測 ? 北米、欧州、アジア太平洋、ラテンアメリカ、中東・アフリカ(MEA)における小型ドローン市場の2026年から2036年までの予測をご覧ください。また、米国、カナダ、メキシコ、ブラジル、ドイツ、フランス、英国、イタリア、中国、インド、日本、オーストラリアをはじめとする主要経済圏の市場予測も掲載されています。
-
既存企業および市場参入を目指す企業への展望 ? 2026年から2036年までの小型ドローン市場に関わる主要企業25社の企業プロファイルを含みます。
この市場分析が重要な理由
自律性、センサー技術、データ分析の進歩により無人航空システムの運用価値が拡大する中、小型ドローン市場は急速に進化しています。防衛機関、民間企業、公共部門の機関は、状況認識、効率性、安全性を向上させるため、日常業務へのドローンの導入をますます進めています。
規制枠組みの変遷、技術開発、サプライチェーンのリスクを把握している企業は、2036年までの世界小型ドローン市場における長期的な機会を捉える上で、より有利な立場に立つことになるでしょう。
ページTOPに戻る
目次
1 レポートの概要
1.1 本調査の目的
1.2 小型ドローン市場の概要
1.3 本レポートの内容
1.4 本レポートを読むべき理由
1.5 本分析レポートが回答する主要な質問
1.6 本レポートの対象読者
1.7 調査方法
1.7.1 市場の定義
1.7.2 市場評価および予測の方法論
1.7.3 データの検証
1.7.3.1 一次調査
1.7.3.2 二次調査
1.8 よくある質問(FAQ)
1.9 関連するVisiongainレポート
1.10 Visiongainについて
2 概要
3 市場の概要
3.1 主な調査結果
3.2 市場の動向
3.3 影響分析
3.3.1 市場の成長要因
3.3.1.1 小型ドローン市場の成長を牽引する軍事・国土安全保障分野の需要
3.3.1.2 市場の成長を後押しする規制の進展
3.3.1.3 市場の成長を牽引する精密農業の台頭
3.3.2 市場の抑制要因
3.3.2.1 飛行持続時間の制限および積載量の制約が市場成長を抑制
3.3.2.2 気象への依存度および運用リスクが市場成長を阻害
3.3.3 市場の機会
3.3.3.1 商用および民生用途の拡大が市場成長の機会
3.3.3.2 小型ドローンへの多額の投資が市場成長の機会となる
3.3.3.3 市場プレイヤー間の連携と提携が市場成長の機会となる
3.4 米国の関税:世界の小型ドローン市場への影響は?
3.4.1 概要
3.4.2 V字型回復シナリオ
3.4.2.1 なぜV字型回復なのか?
3.4.2.2 関税による影響
3.4.2.3 市場の動向と需要の回復
3.4.2.4 政策および資金支援
3.4.2.5 回復までの期間
3.4.3 U字型回復シナリオ
3.4.3.1 なぜU字型回復なのか?
3.4.3.2 関税の影響
3.4.3.3 市場の動向と需要の回復
3.4.3.4 政策および資金支援
3.4.3.5 回復までの期間
3.4.4 L字型回復シナリオ
3.4.4.1 なぜL字型回復なのか?
3.4.4.2 関税の影響
3.4.4.3 市場の動向と需要の回復
3.4.4.4 政策および資金支援
3.4.4.5 回復までの期間
3.4.5 顧客は短期(2026~2031年)および長期(2026~2036年)の計画において、どのような戦略的考慮事項を盛り込むべきか?
3.4.6 米中貿易戦争が小型ドローン市場に与える影響
3.4.7 最も影響を受ける国々は、これらの政策変更によりどのようなプラスおよびマイナスの影響を受ける可能性があるか?
3.5 ポーターの5つの力分析
3.5.1 供給者の交渉力 ? 高い
3.5.2 購入者の交渉力 ? 中程度
3.5.3 競合の激しさ ? 高い
3.5.4 代替品の脅威 ? 低い
3.5.5 新規参入の脅威 ? 中程度
3.6 PESTLE分析
4 小型ドローン市場分析:推進方式別
4.1 主な調査結果
4.2 推進方式別:市場魅力度指数
4.3 推進方式別の小型ドローン市場規模の推計と予測
4.4 電気推進
4.4.1 地域別市場規模、2026年~2036年(百万米ドル)
4.4.2 地域別市場シェア、2026年および2036年(%)
4.5 ハイブリッド/ガソリン推進
4.5.1 地域別市場規模、2026年~2036年(百万米ドル)
4.5.2 地域別市場シェア、2026年および2036年(%)
5 小型ドローン市場分析:プラットフォーム別
5.1 主な調査結果
5.2 プラットフォーム別:市場魅力度指数
5.3 プラットフォーム別小型ドローン市場規模の推計と予測
5.4 回転翼(マルチローター)
5.4.1 地域別市場規模、2026年~2036年(百万米ドル)
5.4.2 地域別市場シェア、2026年および2036年(%)
5.5 固定翼
5.5.1 地域別市場規模、2026年~2036年(百万米ドル)
5.5.2 地域別市場シェア、2026年および2036年(%)
5.6 ハイブリッドVTOL
5.6.1 地域別市場規模、2026年~2036年(百万米ドル)
5.6.2 地域別市場シェア、2026年および2036年(%)
6 小型ドローン市場分析:最大離陸重量(MTOW)別
6.1 主な調査結果
6.2 最大離陸重量(MTOW)別セグメント:市場魅力度指数
6.3 最大離陸重量(MTOW)別小型ドローン市場規模の推計と予測
6.4 250 g未満
6.4.1 地域別市場規模、2026年~2036年(百万米ドル)
6.4.2 地域別市場シェア、2026年および2036年(%)
6.5 250 g~2 kg
6.5.1 地域別市場規模、2026年~2036年(百万米ドル)
6.5.2 地域別市場シェア、2026年および2036年(%)
6.6 2~10 kg
6.6.1 地域別市場規模、2026年~2036年(百万米ドル)
6.6.2 地域別市場シェア、2026年および2036年(%)
6.7 10~25 kg
6.7.1 地域別市場規模、2026年~2036年(百万米ドル)
6.7.2 地域別市場シェア、2026年および2036年(%)
7 小型ドローン市場分析:用途別
7.1 主な調査結果
7.2 用途別セグメント:市場魅力度指数
7.3 用途別小型ドローン市場規模の推計と予測
7.4 セキュリティ・監視(ISR)
7.4.1 地域別市場規模、2026年~2036年(百万米ドル)
7.4.2 地域別市場シェア、2026年および2036年(%)
7.5 航空撮影・測量
7.5.1 地域別市場規模、2026年~2036年(百万米ドル)
7.5.2 地域別市場シェア、2026年および2036年(%)
7.6 検査・モニタリング
7.6.1 地域別市場規模、2026年~2036年(百万米ドル)
7.6.2 地域別市場シェア、2026年および2036年(%)
7.7 農業
7.7.1 地域別市場規模、2026年~2036年(百万米ドル)
7.7.2 地域別市場シェア、2026年および2036年(%)
7.8 その他の用途
7.8.1 地域別市場規模、2026年~2036年(百万米ドル)
7.8.2 地域別市場シェア、2026年および2036年(%)
8 小型ドローン市場分析:ペイロードタイプ別
8.1 主な調査結果
8.2 ペイロードタイプ別セグメント:市場魅力度指数
8.3 ペイロードタイプ別の小型ドローン市場規模の推計と予測
8.4 光学ペイロード
8.4.1 地域別市場規模、2026年~2036年(百万米ドル)
8.4.2 地域別市場シェア、2026年および2036年(%)
8.5 LiDARペイロード
8.5.1 地域別市場規模、2026年~2036年(百万米ドル)
8.5.2 地域別市場シェア、2026年および2036年(%)
8.6 SIGINT / EWペイロード
8.6.1 地域別市場規模、2026年~2036年(百万米ドル)
8.6.2 地域別市場シェア、2026年および2036年(%)
8.7 サーマルイメージングペイロード
8.7.1 地域別市場規模、2026年~2036年(百万米ドル)
8.7.2 地域別市場シェア、2026年および2036年(%)
8.8 多波長ペイロード
8.8.1 地域別市場規模、2026年~2036年(百万米ドル)
8.8.2 地域別市場シェア、2026年および2036年(%)
8.9 ハイパースペクトルペイロード
8.9.1 地域別市場規模、2026年~2036年(百万米ドル)
8.9.2 地域別市場シェア、2026年および2036年(%)
9 小型ドローン市場分析:地域別
9.1 主な調査結果
9.2 地域別市場規模の推計と予測
10 北米小型ドローン市場分析
10.1 主な調査結果
10.2 北米小型ドローン市場の魅力度指数
10.3 北米小型ドローン市場:国別、2026年、2031年、2036年(百万米ドル)
10.4 北米小型ドローン市場規模の推定と予測:国別
10.5 北米小型ドローン市場規模の推定と予測:推進方式別
10.6 北米小型ドローン市場規模の推定と予測:プラットフォーム別
10.7 北米小型ドローン市場規模の推定と予測:最大離陸重量(MTOW)別
10.8 北米小型ドローン市場規模の推定と予測:用途別
10.9 北米小型ドローン市場規模の推定と予測:ペイロードタイプ別
10.10 米国小型ドローン市場分析
10.11 カナダ小型ドローン市場分析
11 欧州の小型ドローン市場分析
11.1 主な調査結果
11.2 欧州小型ドローン市場の魅力度指数
11.3 欧州小型ドローン市場:国別、2026年、2031年、2036年(百万米ドル)
11.4 欧州小型ドローン市場規模の推定と予測:国別
11.5 欧州小型ドローン市場規模の推定と予測:推進方式別
11.6 欧州小型ドローン市場規模の推定と予測:プラットフォーム別
11.7 欧州小型ドローン市場規模の推定と予測:最大離陸重量(MTOW)別
11.8 欧州小型ドローン市場規模の推定と予測:用途別
11.9 欧州小型ドローン市場規模の推定と予測:ペイロードタイプ別
11.10 ドイツの小型ドローン市場分析
11.11 英国の小型ドローン市場分析
11.12 フランスの小型ドローン市場分析
11.13 イタリアの小型ドローン市場分析
11.14 スペインの小型ドローン市場分析
11.15 その他の欧州諸国の小型ドローン市場分析
12 アジア太平洋地域の小型ドローン市場分析
12.1 主な調査結果
12.2 アジア太平洋地域の小型ドローン市場の魅力度指数
12.3 アジア太平洋地域の小型ドローン市場:国別、2026年、2031年、2036年)(百万米ドル)
12.4 アジア太平洋地域の小型ドローン市場規模の推定と予測:国別
12.5 アジア太平洋地域の小型ドローン市場規模の推定と予測:推進方式別
12.6 アジア太平洋地域の小型ドローン市場規模の推定と予測:プラットフォーム別
12.7 アジア太平洋地域の小型ドローン市場規模の推定と予測:最大離陸重量(MTOW)別
12.8 アジア太平洋地域の小型ドローン市場規模の推定と予測:用途別
12.9 アジア太平洋地域の小型ドローン市場規模の推定と予測:ペイロードタイプ別
12.10 中国の小型ドローン市場分析
12.11 インドの小型ドローン市場分析
12.12 日本の小型ドローン市場分析
12.13 韓国の小型ドローン市場分析
12.14 オーストラリアの小型ドローン市場分析
12.15 その他のアジア太平洋地域の小型ドローン市場分析
13 中東・アフリカの小型ドローン市場の分析
13.1 主な調査結果
13.2 中東・アフリカの小型ドローン市場の魅力度指数
13.3 中東・アフリカの小型ドローン市場:国別、2026年、2031年、2036年(百万米ドル)
13.4 中東・アフリカの小型ドローン市場規模の推定と予測:国別
13.5 中東・アフリカの小型ドローン市場規模の推定と予測:推進方式別
13.6 中東・アフリカの小型ドローン市場規模の推定と予測:プラットフォーム別
13.7 中東・アフリカの小型ドローン市場規模の推定と予測:最大離陸重量(MTOW)別
13.8 中東・アフリカの小型ドローン市場規模の推定と予測:用途別
13.9 中東・アフリカの小型ドローン市場規模の推定と予測:ペイロードタイプ別
13.10 GCC地域の小型ドローン市場分析
13.11 イスラエルの小型ドローン市場分析
13.12 その他の中東・アフリカ地域の小型ドローン市場分析
14 ラテンアメリカの小型ドローン市場分析
14.1 主な調査結果
14.2 ラテンアメリカ小型ドローン市場の魅力度指数
14.3 ラテンアメリカ小型ドローン市場:国別、2026年、2031年、2036年(百万米ドル)
14.4 ラテンアメリカ小型ドローン市場規模の推定と予測:国別
14.5 ラテンアメリカ小型ドローン市場規模の推定と予測:推進方式別
14.6 ラテンアメリカ小型ドローン市場規模の推定と予測:プラットフォーム別
14.7 ラテンアメリカ小型ドローン市場規模の推定と予測:最大離陸重量(MTOW)別
14.8 ラテンアメリカ小型ドローン市場規模の推定と予測:用途別
14.9 ラテンアメリカ小型ドローン市場規模の推定と予測:ペイロードタイプ別
14.10 ブラジル小型ドローン市場分析
14.11 メキシコ小型ドローン市場分析
14.12 その他のラテンアメリカ小型ドローン市場分析
15 主要企業の概要
15.1 2024年の競合環境分析
15.2 戦略的展望
15.3 DJI(大疆創新)
15.3.1 企業概要
15.3.2 会社概要
15.3.3 製品ベンチマーク
15.3.4 戦略的展望
15.3.5 SWOT分析
15.4 AeroVironment
15.4.1 企業概要
15.4.2 会社概要
15.4.3 財務分析
15.4.3.1 純売上高(2020年~2024年)
15.4.3.2 研究開発費(2020年~2024年)
15.4.3.3 地域別市場シェア(2024年)
15.4.3.4 事業セグメント別市場シェア(2024年)
15.4.4 製品ベンチマーク
15.4.5 戦略的展望
15.4.6 SWOT分析
15.5 スカイディオ
15.5.1 企業概要
15.5.2 会社概要
15.5.3 製品ベンチマーク
15.5.4 戦略的展望
15.5.5 SWOT分析
15.6 パロット
15.6.1 企業概要
15.6.2 会社概要
15.6.3 財務分析
15.6.3.1 純売上高(2020年~2024年)
15.6.3.2 事業セグメント別市場シェア(2024年)
15.6.4 製品ベンチマーク
15.6.5 戦略的展望
15.6.6 SWOT分析
15.7 オートエル・ロボティクス
15.7.1 企業概要
15.7.2 会社概要
15.7.3 製品ベンチマーク
15.7.4 戦略的展望
15.7.5 SWOT分析
15.8 Teledyne FLIR
15.8.1 企業概要
15.8.2 会社概要
15.8.3 財務分析
15.8.3.1 純売上高(2020年~2024年)
15.8.3.2 研究開発費(2020年~2024年)
15.8.3.3 地域別市場シェア(2024年)
15.8.3.4 事業セグメント別市場シェア(2024年)
15.8.4 製品ベンチマーク
15.8.5 戦略的展望
15.8.6 SWOT分析
15.9 エルビット・システムズ
15.9.1 企業概要
15.9.2 会社概要
15.9.3 財務分析
15.9.3.1 純売上高(2020年~2024年)
15.9.3.2 研究開発費(R&D)、2020-2024年
15.9.3.3 地域別市場シェア、2024年
15.9.3.4 事業セグメント別市場シェア、2024年
15.9.4 製品ベンチマーキング
15.9.5 戦略的展望
15.9.6 SWOT分析
15.10 イスラエル・エアロスペース・インダストリーズ
15.10.1 企業概要
15.10.2 会社概要
15.10.3 財務分析
15.10.3.1 純売上高、2020-2024年
15.10.3.2 研究開発(R&D)、2020-2024年
15.10.3.3 地域別市場シェア(2024年)
15.10.3.4 事業セグメント別市場シェア(2024年)
15.10.4 製品ベンチマーク
15.10.5 戦略的展望
15.10.6 SWOT分析
15.11 ノースロップ・グラマン
15.11.1 企業概要
15.11.2 会社概要
15.11.3 財務分析
15.11.3.1 純売上高、2020-2024年
15.11.3.2 研究開発(R&D)、2020-2024年
15.11.3.3 地域別市場シェア(2024年)
15.11.3.4 事業セグメント別市場シェア(2024年)
15.11.4 製品ベンチマーク
15.11.5 戦略的展望
15.11.6 SWOT分析
15.12 ロッキード・マーティン
15.12.1 企業概要
15.12.2 会社概要
15.12.3 財務分析
15.12.3.1 純売上高、2020-2024年
15.12.3.2 研究開発費、2020-2024年
15.12.3.3 地域別市場シェア(2024年)
15.12.3.4 事業セグメント別市場シェア(2024年)
15.12.4 製品ベンチマーク
15.12.5 戦略的展望
15.12.6 SWOT分析
15.13 BAE Systems plc
15.13.1 企業概要
15.13.2 会社概要
15.13.3 財務分析
15.13.3.1 純売上高、2020-2024年
15.13.3.2 研究開発(R&D)、2020-2024年
15.13.3.3 地域別市場シェア(2024年)
15.13.3.4 事業セグメント別市場シェア(2024年)
15.13.4 製品ベンチマーク
15.13.5 戦略的展望
15.13.6 SWOT分析
15.14 Saab AB
15.14.1 企業概要
15.14.2 会社概要
15.14.3 製品ベンチマーク
15.14.4 財務分析
15.14.4.1 純売上高、2020-2024年
15.14.4.2 研究開発費、2020-2024年
15.14.4.3 地域別市場シェア(2024年)
15.14.4.4 事業セグメント別市場シェア(2024年)
15.14.5 戦略的展望
15.14.6 SWOT分析
15.15 ラインメタル
15.15.1 企業概要
15.15.2 会社概要
15.15.3 財務分析
15.15.3.1 純売上高、2020-2024年
15.15.3.2 研究開発費、2020-2024年
15.15.3.3 地域別市場シェア、2024年
15.15.3.4 事業セグメント別市場シェア(2024年)
15.15.4 製品ベンチマーク
15.15.5 戦略的展望
15.15.6 SWOT分析
15.16 タレス・グループ
15.16.1 企業概要
15.16.2 会社概要
15.16.3 財務分析
15.16.3.1 純売上高(2020年~2024年)
15.16.3.2 研究開発費(2020年~2024年)
15.16.3.3 地域別市場シェア(2024年)
15.16.3.4 事業セグメント別市場シェア(2024年)
15.16.4 製品ベンチマーク
15.16.5 戦略的展望
15.16.6 SWOT分析
15.17 Quantum-Systems
15.17.1 企業概要
15.17.2 会社概要
15.17.3 製品ベンチマーク
15.17.4 戦略的展望
15.17.5 SWOT分析
15.18 Uvision Air Ltd.
15.18.1 企業概要
15.18.2 会社概要
15.18.3 製品ベンチマーク
15.18.4 戦略的展望
15.18.5 SWOT分析
15.19 UVify
15.19.1 企業概要
15.19.2 会社概要
15.19.3 製品ベンチマーク
15.19.4 戦略的展望
15.19.5 SWOT分析
15.20 Delair
15.20.1 企業概要
15.20.2 会社概要
15.20.3 製品ベンチマーク
15.20.4 戦略的展望
15.20.5 SWOT分析
15.21 ideaForge
15.21.1 企業概要
15.21.2 会社概要
15.21.3 財務分析
15.21.3.1 純売上高(2020年~2024年)
15.21.3.2 事業セグメント別市場シェア(2024年)
15.21.4 製品ベンチマーク
15.21.5 戦略的展望
15.21.6 SWOT分析
15.22 アステリア・エアロスペース
15.22.1 企業概要
15.22.2 会社概要
15.22.3 製品ベンチマーク
15.22.4 戦略的展望
15.22.5 SWOT分析
15.23 エッジ・オートノミー
15.23.1 企業概要
15.23.2 会社概要
15.23.3 製品ベンチマーク
15.23.4 戦略的展望
15.23.5 SWOT分析
15.24 EHang
15.24.1 会社概要
15.24.2 会社概要
15.24.3 財務分析
15.24.3.1 純売上高(2020年~2024年)
15.24.4 製品ベンチマーク
15.24.5 戦略的展望
15.24.6 SWOT分析
15.25 Yuneec
15.25.1 企業概要
15.25.2 会社概要
15.25.3 製品ベンチマーク
15.25.4 戦略的展望
15.25.5 SWOT分析
15.26 ウィングトラ
15.26.1 企業概要
15.26.2 会社概要
15.26.3 製品ベンチマーク
15.26.4 戦略的展望
15.26.5 SWOT分析
15.27 ジェネラル・アトミクス・エアロノーティカル・システムズ
15.27.1 企業概要
15.27.2 会社概要
15.27.3 製品ベンチマーク
15.27.4 戦略的展望
15.27.5 SWOT分析
16 結論と提言
16.1 Visiongainによる総括
16.2 市場参加者への提言
ページTOPに戻る
図表リスト
List of Tables
Table 1 Small Drones Market Snapshot, 2026 & 2036 (US$ Million, CAGR %)
Table 2 Leading Manufacturers & Platforms for Agriculture Drone
Table 3 Leading Manufacturers & Platforms for Precision Agriculture
Table 4 Small Drones Market: International Trade Tariff Impact Recovery Scenarios Snapshot
Table 5 Global Small Drones Market by Region, 2026-2036 (US$ Mn, AGR (%), CAGR (%)), Tariff Impact V-Shaped Recovery Scenario
Table 6 Global Small Drones Market by Region, 2026-2036 (US$ Mn, AGR (%), CAGR (%)), Tariff Impact U-Shaped Recovery Scenario
Table 7 Global Small Drones Market by Region, 2026-2036 (US$ Mn, AGR (%), CAGR (%)), Tariff Impact L-Shaped Recovery Scenario
Table 8 Global Small Drones Market by Propulsion, 2026-2036 (US$ Mn, AGR (%), CAGR (%))
Table 9 Electric Propulsion Market by Region, 2026-2036 (US$ Mn, AGR (%), CAGR (%))
Table 10 Hybrid/ Gasoline Propulsion Market by Region, 2026-2036 (US$ Mn, AGR (%), CAGR (%))
Table 11 Global Small Drones Market by Platform, 2026-2036 (US$ Mn, AGR (%), CAGR (%))
Table 12 Rotary-Wing (Multirotor) Market by Region, 2026-2036 (US$ Mn, AGR (%), CAGR (%))
Table 13 Fixed-Wing Market by Region, 2026-2036 (US$ Mn, AGR (%), CAGR (%))
Table 14 Hybrid VTOL Market by Region, 2026-2036 (US$ Mn, AGR (%), CAGR (%))
Table 15 Global Small Drones Market by Maximum Take-off Weight (MTOW), 2026-2036 (US$ Mn, AGR (%), CAGR (%))
Table 16 <250 g Market by Region, 2026-2036 (US$ Mn, AGR (%), CAGR (%))
Table 17 250 g–2 kg Market by Region, 2026-2036 (US$ Mn, AGR (%), CAGR (%))
Table 18 2–10 kg Market by Region, 2026-2036 (US$ Mn, AGR (%), CAGR (%))
Table 19 10–25 kg Market by Region, 2026-2036 (US$ Mn, AGR (%), CAGR (%))
Table 20 Global Small Drones Market by Application, 2026-2036 (US$ Mn, AGR (%), CAGR (%))
Table 21 Security & Surveillance (ISR) Market by Region, 2026-2036 (US$ Mn, AGR (%), CAGR (%))
Table 22 Aerial Imaging & Surveying Market by Region, 2026-2036 (US$ Mn, AGR (%), CAGR (%))
Table 23 Inspection & Monitoring Market by Region, 2026-2036 (US$ Mn, AGR (%), CAGR (%))
Table 24 Agriculture Market by Region, 2026-2036 (US$ Mn, AGR (%), CAGR (%))
Table 25 Other Applications Market by Region, 2026-2036 (US$ Mn, AGR (%), CAGR (%))
Table 26 Global Small Drones Market by Payload Type, 2026-2036 (US$ Mn, AGR (%), CAGR (%))
Table 27 Optical Payloads Market by Region, 2026-2036 (US$ Mn, AGR (%), CAGR (%))
Table 28 LiDAR Payloads Market by Region, 2026-2036 (US$ Mn, AGR (%), CAGR (%))
Table 29 SIGINT / EW Payloads Market by Region, 2026-2036 (US$ Mn, AGR (%), CAGR (%))
Table 30 Thermal Imaging Payloads Market by Region, 2026-2036 (US$ Mn, AGR (%), CAGR (%))
Table 31 Multispectral Payloads Market by Region, 2026-2036 (US$ Mn, AGR (%), CAGR (%))
Table 32 Hyperspectral Payloads Market by Region, 2026-2036 (US$ Mn, AGR (%), CAGR (%))
Table 33 Global Small Drones Market by Region, 2026-2036 (US$ Mn, AGR (%), CAGR (%))
Table 34 North America Small Drones Market by Country, 2026-2036 (US$ Mn, AGR (%), CAGR (%))
Table 35 North America Small Drones Market by Propulsion, 2026-2036 (US$ Mn, AGR (%), CAGR (%))
Table 36 North America Small Drones Market by Platform, 2026-2036 (US$ Mn, AGR (%), CAGR (%))
Table 37 North America Small Drones Market by Maximum Take-off Weight (MTOW), 2026-2036 (US$ Mn, AGR (%), CAGR (%))
Table 38 North America Small Drones Market by Application, 2026-2036 (US$ Mn, AGR (%), CAGR (%))
Table 39 North America Small Drones Market by Payload Type, 2026-2036 (US$ Mn, AGR (%), CAGR (%))
Table 40 US Small Drones Market by Value, 2026-2036 (US$ Mn, AGR (%), CAGR (%))
Table 41 Canada Small Drones Market by Value, 2026-2036 (US$ Mn, AGR (%), CAGR (%))
Table 42 Europe Small Drones Market by Country, 2026-2036 (US$ Mn, AGR (%), CAGR (%))
Table 43 Europe Small Drones Market by Propulsion, 2026-2036 (US$ Mn, AGR (%), CAGR (%))
Table 44 Europe Small Drones Market by Platform, 2026-2036 (US$ Mn, AGR (%), CAGR (%))
Table 45 Europe Small Drones Market by Maximum Take-off Weight (MTOW), 2026-2036 (US$ Mn, AGR (%), CAGR (%))
Table 46 Europe Small Drones Market by Application, 2026-2036 (US$ Mn, AGR (%), CAGR (%))
Table 47 Europe Small Drones Market by Payload Type, 2026-2036 (US$ Mn, AGR (%), CAGR (%))
Table 48 Germany Small Drones Market by Value, 2026-2036 (US$ Mn, AGR (%), CAGR (%))
Table 49 UK Small Drones Market by Value, 2026-2036 (US$ Mn, AGR (%), CAGR (%))
Table 50 France Small Drones Market by Value, 2026-2036 (US$ Mn, AGR (%), CAGR (%))
Table 51 Italy Small Drones Market by Value, 2026-2036 (US$ Mn, AGR (%), CAGR (%))
Table 52 Spain Small Drones Market by Value, 2026-2036 (US$ Mn, AGR (%), CAGR (%))
Table 53 Rest of Europe Small Drones Market by Value, 2026-2036 (US$ Mn, AGR (%), CAGR (%))
Table 54 Asia-Pacific Small Drones Market by Country, 2026-2036 (US$ Mn, AGR (%), CAGR (%))
Table 55 Asia-Pacific Small Drones Market by Propulsion, 2026-2036 (US$ Mn, AGR (%), CAGR (%))
Table 56 Asia-Pacific Small Drones Market by Platform, 2026-2036 (US$ Mn, AGR (%), CAGR (%))
Table 57 Asia-Pacific Small Drones Market by Maximum Take-off Weight (MTOW), 2026-2036 (US$ Mn, AGR (%), CAGR (%))
Table 58 Asia-Pacific Small Drones Market by Application, 2026-2036 (US$ Mn, AGR (%), CAGR (%))
Table 59 Asia-Pacific Small Drones Market by Payload Type, 2026-2036 (US$ Mn, AGR (%), CAGR (%))
Table 60 China Small Drones Market by Value, 2026-2036 (US$ Mn, AGR (%), CAGR (%))
Table 61 India Small Drones Market by Value, 2026-2036 (US$ Mn, AGR (%), CAGR (%))
Table 62 Japan Small Drones Market by Value, 2026-2036 (US$ Mn, AGR (%), CAGR (%))
Table 63 South Korea Small Drones Market by Value, 2026-2036 (US$ Mn, AGR (%), CAGR (%))
Table 64 Australia Small Drones Market by Value, 2026-2036 (US$ Mn, AGR (%), CAGR (%))
Table 65 Rest of Asia-Pacific Small Drones Market by Value, 2026-2036 (US$ Mn, AGR (%), CAGR (%))
Table 66 Middle East & Africa Small Drones Market by Country, 2026-2036 (US$ Mn, AGR (%), CAGR (%))
Table 67 Middle East & Africa Small Drones Market by Propulsion, 2026-2036 (US$ Mn, AGR (%), CAGR (%))
Table 68 Middle East & Africa Small Drones Market by Platform, 2026-2036 (US$ Mn, AGR (%), CAGR (%))
Table 69 Middle East & Africa Small Drones Market by Maximum Take-off Weight (MTOW), 2026-2036 (US$ Mn, AGR (%), CAGR (%))
Table 70 Middle East & Africa Small Drones Market by Application, 2026-2036 (US$ Mn, AGR (%), CAGR (%))
Table 71 Middle East & Africa Small Drones Market by Payload Type, 2026-2036 (US$ Mn, AGR (%), CAGR (%))
Table 72 GCC Small Drones Market by Value, 2026-2036 (US$ Mn, AGR (%), CAGR (%))
Table 73 Israel Small Drones Market by Value, 2026-2036 (US$ Mn, AGR (%), CAGR (%))
Table 74 Rest of Middle East & Africa Small Drones Market by Value, 2026-2036 (US$ Mn, AGR (%), CAGR (%))
Table 75 Latin America Small Drones Market by Country, 2026-2036 (US$ Mn, AGR (%), CAGR (%))
Table 76 Latin America Small Drones Market by Propulsion, 2026-2036 (US$ Mn, AGR (%), CAGR (%))
Table 77 Latin America Small Drones Market by Platform, 2026-2036 (US$ Mn, AGR (%), CAGR (%))
Table 78 Latin America Small Drones Market by Maximum Take-off Weight (MTOW), 2026-2036 (US$ Mn, AGR (%), CAGR (%))
Table 79 Latin America Small Drones Market by Application, 2026-2036 (US$ Mn, AGR (%), CAGR (%))
Table 80 Latin America Small Drones Market by Payload Type, 2026-2036 (US$ Mn, AGR (%), CAGR (%))
Table 81 Brazil Small Drones Market by Value, 2026-2036 (US$ Mn, AGR (%), CAGR (%))
Table 82 Mexico Small Drones Market by Value, 2026-2036 (US$ Mn, AGR (%), CAGR (%))
Table 83 Rest of Latin America Small Drones Market by Value, 2026-2036 (US$ Mn, AGR (%), CAGR (%))
Table 84 Strategic Outlook
Table 85 DJI (Da-Jiang Innovations): Key Details, (CEO, HQ, Revenue, Founded, No. of Employees, Company Type, Website, Business Segment)
Table 86 DJI (Da-Jiang Innovations): Product Benchmarking
Table 87 DJI (Da-Jiang Innovations): Strategic Outlook
Table 88 AeroVironment: Key Details, (CEO, HQ, Revenue, Founded, No. of Employees, Company Type, Website, Business Segment)
Table 89 AeroVironment: Product Benchmarking
Table 90 AeroVironment: Strategic Outlook
Table 91 Skydio: Key Details, (CEO, HQ, Revenue, Founded, No. of Employees, Company Type, Website, Business Segment)
Table 92 Skydio: Product Benchmarking
Table 93 Skydio: Strategic Outlook
Table 94 Parrot: Key Details, (CEO, HQ, Revenue, Founded, No. of Employees, Company Type, Website, Business Segment)
Table 95 Parrot: Product Benchmarking
Table 96 Parrot: Strategic Outlook
Table 97 Autel Robotics: Key Details, (CEO, HQ, Revenue, Founded, No. of Employees, Company Type, Website, Business Segment)
Table 98 Autel Robotics: Product Benchmarking
Table 99 Autel Robotics: Strategic Outlook
Table 100 Teledyne FLIR: Key Details, (CEO, HQ, Revenue, Founded, No. of Employees, Company Type, Website, Business Segment)
Table 101 Teledyne FLIR: Product Benchmarking
Table 102 Teledyne FLIR: Strategic Outlook
Table 103 Elbit Systems: Key Details, (CEO, HQ, Revenue, Founded, No. of Employees, Company Type, Website, Business Segment)
Table 104 Elbit Systems: Product Benchmarking
Table 105 Elbit Systems: Strategic Outlook
Table 106 Israel Aerospace Industries: Key Details, (CEO, HQ, Revenue, Founded, No. of Employees, Company Type, Website, Business Segment)
Table 107 Israel Aerospace Industries: Product Benchmarking
Table 108 Israel Aerospace Industries: Strategic Outlook
Table 109 Northrop Grumman: Key Details, (CEO, HQ, Revenue, Founded, No. of Employees, Company Type, Website, Business Segment)
Table 110 Northrop Grumman: Product Benchmarking
Table 111 Northrop Grumman: Strategic Outlook
Table 112 Lockheed Martin: Key Details, (CEO, HQ, Revenue, Founded, No. of Employees, Company Type, Website, Business Segment)
Table 113 Lockheed Martin: Product Benchmarking
Table 114 Lockheed Martin: Strategic Outlook
Table 115 BAE Systems plc: Key Details, (CEO, HQ, Revenue, Founded, No. of Employees, Company Type, Website, Business Segment)
Table 116 BAE Systems plc: Product Benchmarking
Table 117 BAE Systems plc: Strategic Outlook
Table 118 Saab AB: Key Details, (CEO, HQ, Revenue, Founded, No. of Employees, Company Type, Website, Business Segment)
Table 119 Saab AB: Product Benchmarking
Table 120 Saab AB: Strategic Outlook
Table 121 Rheinmetall: Key Details, (CEO, HQ, Revenue, Founded, No. of Employees, Company Type, Website, Business Segment)
Table 122 Rheinmetall: Product Benchmarking
Table 123 Rheinmetall: Strategic Outlook
Table 124 Thales Group: Key Details, (CEO, HQ, Revenue, Founded, No. of Employees, Company Type, Website, Business Segment)
Table 125 Thales Group: Product Benchmarking
Table 126 Thales Group: Strategic Outlook
Table 127 Quantum-Systems: Key Details, (CEO, HQ, Revenue, Founded, No. of Employees, Company Type, Website, Business Segment)
Table 128 Quantum-Systems: Product Benchmarking
Table 129 Quantum-Systems: Strategic Outlook
Table 130 Uvision Air Ltd.: Key Details, (CEO, HQ, Revenue, Founded, No. of Employees, Company Type, Website, Business Segment)
Table 131 Uvision Air Ltd.: Product Benchmarking
Table 132 Uvision Air Ltd.: Strategic Outlook
Table 133 UVify: Key Details, (CEO, HQ, Revenue, Founded, No. of Employees, Company Type, Website, Business Segment)
Table 134 UVify Factories (POF): Product Benchmarking
Table 135 UVify: Strategic Outlook
Table 136 Delair Key Details, (CEO, HQ, Revenue, Founded, No. of Employees, Company Type, Website, Business Segment)
Table 137 Delair: Product Benchmarking
Table 138 Delair: Strategic Outlook
Table 139 ideaForge: Key Details, (CEO, HQ, Revenue, Founded, No. of Employees, Company Type, Website, Business Segment)
Table 140 IdeaForge: Product Benchmarking
Table 141 IdeaForge: Strategic Outlook
Table 142 Asteria Aerospace: Key Details, (CEO, HQ, Revenue, Founded, No. of Employees, Company Type, Website, Business Segment)
Table 143 Asteria Aerospace: Product Benchmarking
Table 144 Asteria Aerospace: Strategic Outlook
Table 145 Edge Autonomy: Key Details, (CEO, HQ, Revenue, Founded, No. of Employees, Company Type, Website, Business Segment)
Table 146 Edge Autonomy Factories (POF): Product Benchmarking
Table 147 Edge Autonomy: Strategic Outlook
Table 148 EHang Key Details, (CEO, HQ, Revenue, Founded, No. of Employees, Company Type, Website, Business Segment)
Table 149 EHang: Product Benchmarking
Table 150 EHang: Strategic Outlook
Table 151 Yuneec: Key Details, (CEO, HQ, Revenue, Founded, No. of Employees, Company Type, Website, Business Segment)
Table 152 Yuneec: Product Benchmarking
Table 153 Yuneec: Strategic Outlook
Table 154 Wingtra: Key Details, (CEO, HQ, Revenue, Founded, No. of Employees, Company Type, Website, Business Segment)
Table 155 Wingtra: Product Benchmarking
Table 156 Wingtra: Strategic Outlook
Table 157 General Atomics Aeronautical Systems: Key Details, (CEO, HQ, Revenue, Founded, No. of Employees, Company Type, Website, Business Segment)
Table 158 General Atomics Aeronautical Systems: Product Benchmarking
Table 159 General Atomics Aeronautical Systems: Strategic Outlook
List of Figures
Figure 1 Small Drones Market Segmentation
Figure 2 Small Drones Market by Propulsion: Market Attractiveness Index
Figure 3 Small Drones Market by Platform: Market Attractiveness Index
Figure 4 Small Drones Market by Maximum Take-off Weight (MTOW): Market Attractiveness Index
Figure 5 Small Drones Market by Application: Market Attractiveness Index
Figure 6 Small Drones Market by Payload Type: Market Attractiveness Index
Figure 7 Small Drones Market Attractiveness Index by Region
Figure 8 Small Drones Market: Market Dynamics
Figure 9 Small Drones Market: Impact Analysis
Figure 10 Global Small Drones Market by Region, 2026-2036 (US$ Mn, AGR (%)), Tariff Impact V-Shaped Recovery Scenario
Figure 11 Global Small Drones Market by Region, 2026-2036 (US$ Mn, AGR (%)), Tariff Impact U-Shaped Recovery Scenario
Figure 12 Global Small Drones Market by Region, 2026-2036 (US$ Mn, AGR (%)), Tariff Impact L-Shaped Recovery Scenario
Figure 13 Small Drones Market: Porter’s Five Forces Analysis
Figure 14 Small Drones Market: PESTLE Analysis
Figure 15 Small Drones Market by Propulsion: Market Attractiveness Index
Figure 16 Global Small Drones Market by Propulsion, 2026-2036 (US$ Mn, AGR (%))
Figure 17 Small Drones Market Share Forecast by Propulsion, 2026, 2031, 2036 (%)
Figure 18 Electric Propulsion Market by Region, 2026-2036 (US$ Mn, AGR (%))
Figure 19 Electric Propulsion Segment Market Share Forecast by Region, 2026 & 2036 (%)
Figure 20 Hybrid/ Gasoline Propulsion Market by Region, 2026-2036 (US$ Mn, AGR (%))
Figure 21 Hybrid/ Gasoline Propulsion Segment Market Share Forecast by Region, 2026 & 2036 (%)
Figure 22 Small Drones Market by Platform: Market Attractiveness Index
Figure 23 Global Small Drones Market by Platform, 2026-2036 (US$ Mn, AGR (%))
Figure 24 Small Drones Market Share Forecast by Platform, 2026, 2031, 2036 (%)
Figure 25 Rotary-Wing (Multirotor) Market by Region, 2026-2036 (US$ Mn, AGR (%))
Figure 26 Rotary-Wing (Multirotor) Segment Market Share Forecast by Region, 2026 & 2036 (%)
Figure 27 Fixed-Wing Market by Region, 2026-2036 (US$ Mn, AGR (%))
Figure 28 Fixed-Wing Segment Market Share Forecast by Region, 2026 & 2036 (%)
Figure 29 Hybrid VTOL Market by Region, 2026-2036 (US$ Mn, AGR (%))
Figure 30 Hybrid VTOL Segment Market Share Forecast by Region, 2026 & 2036 (%)
Figure 31 Small Drones Market by Maximum Take-off Weight (MTOW): Market Attractiveness Index
Figure 32 Global Small Drones Market by Maximum Take-off Weight (MTOW), 2026-2036 (US$ Mn, AGR (%))
Figure 33 Small Drones Market Share Forecast by Maximum Take-off Weight (MTOW), 2026, 2031, 2036 (%)
Figure 34 <250 g Market by Region, 2026-2036 (US$ Mn, AGR (%))
Figure 35 <250 g Segment Market Share Forecast by Region, 2026 & 2036 (%)
Figure 36 250 g–2 kg Market by Region, 2026-2036 (US$ Mn, AGR (%))
Figure 37 250 g–2 kg Segment Market Share Forecast by Region, 2026 & 2036 (%)
Figure 38 2–10 kg Market by Region, 2026-2036 (US$ Mn, AGR (%))
Figure 39 2–10 kg Segment Market Share Forecast by Region, 2026 & 2036 (%)
Figure 40 10–25 kg Market by Region, 2026-2036 (US$ Mn, AGR (%))
Figure 41 10–25 kg Segment Market Share Forecast by Region, 2026 & 2036 (%)
Figure 42 Small Drones Market by Application: Market Attractiveness Index
Figure 43 Global Small Drones Market by Application, 2026-2036 (US$ Mn, AGR (%))
Figure 44 Small Drones Market Share Forecast by Application, 2026, 2031, 2036 (%)
Figure 45 Security & Surveillance (ISR) Market by Region, 2026-2036 (US$ Mn, AGR (%))
Figure 46 Security & Surveillance (ISR) Segment Market Share Forecast by Region, 2026 & 2036 (%)
Figure 47 Aerial Imaging & Surveying Market by Region, 2026-2036 (US$ Mn, AGR (%))
Figure 48 Aerial Imaging & Surveying Segment Market Share Forecast by Region, 2026 & 2036 (%)
Figure 49 Inspection & Monitoring Market by Region, 2026-2036 (US$ Mn, AGR (%))
Figure 50 Inspection & Monitoring Segment Market Share Forecast by Region, 2026 & 2036 (%)
Figure 51 Agriculture Market by Region, 2026-2036 (US$ Mn, AGR (%))
Figure 52 Agriculture Segment Market Share Forecast by Region, 2026 & 2036 (%)
Figure 53 Other Applications Market by Region, 2026-2036 (US$ Mn, AGR (%))
Figure 54 Other Applications Segment Market Share Forecast by Region, 2026 & 2036 (%)
Figure 55 Small Drones Market by Payload Type: Market Attractiveness Index
Figure 56 Global Small Drones Market by Payload Type, 2026-2036 (US$ Mn, AGR (%))
Figure 57 Small Drones Market Share Forecast by Payload Type, 2026, 2031, 2036 (%)
Figure 58 Optical Payloads Market by Region, 2026-2036 (US$ Mn, AGR (%))
Figure 59 Optical Payloads Segment Market Share Forecast by Region, 2026 & 2036 (%)
Figure 60 LiDAR Payloads Market by Region, 2026-2036 (US$ Mn, AGR (%))
Figure 61 LiDAR Payloads Segment Market Share Forecast by Region, 2026 & 2036 (%)
Figure 62 SIGINT / EW Payloads Market by Region, 2026-2036 (US$ Mn, AGR (%))
Figure 63 SIGINT / EW Payloads Segment Market Share Forecast by Region, 2026 & 2036 (%)
Figure 64 Thermal Imaging Payloads Market by Region, 2026-2036 (US$ Mn, AGR (%))
Figure 65 Thermal Imaging Payloads Segment Market Share Forecast by Region, 2026 & 2036 (%)
Figure 66 Multispectral Payloads Market by Region, 2026-2036 (US$ Mn, AGR (%))
Figure 67 Multispectral Payloads Segment Market Share Forecast by Region, 2026 & 2036 (%)
Figure 68 Hyperspectral Payloads Market by Region, 2026-2036 (US$ Mn, AGR (%))
Figure 69 Hyperspectral Payloads Segment Market Share Forecast by Region, 2026 & 2036 (%)
Figure 70 Small Drones Market Forecast by Region 2026 and 2036 (Revenue, CAGR%)
Figure 71 Small Drones Market Share Forecast by Region 2026, 2031, 2036 (%)
Figure 72 Global Small Drones Market by Region, 2026-2036 (US$ Mn, AGR (%))
Figure 73 North America Small Drones Market Attractiveness Index
Figure 74 North America Small Drones Market by Region, 2026, 2031 & 2036 (US$ Million)
Figure 75 North America Small Drones Market by Country, 2026-2036 (US$ Mn, AGR (%))
Figure 76 North America Small Drones Market Share Forecast by Country, 2026 & 2036 (%)
Figure 77 North America Small Drones Market by Propulsion, 2026-2036 (US$ Mn, AGR (%))
Figure 78 North America Small Drones Market Share Forecast by Propulsion, 2026 & 2036 (%)
Figure 79 North America Small Drones Market by Platform, 2026-2036 (US$ Mn, AGR (%))
Figure 80 North America Small Drones Market Share Forecast by Platform, 2026 & 2036 (%)
Figure 81 North America Small Drones Market by Maximum Take-off Weight (MTOW), 2026-2036 (US$ Mn, AGR (%))
Figure 82 North America Small Drones Market Share Forecast by Maximum Take-off Weight (MTOW), 2026 & 2036 (%)
Figure 83 North America Small Drones Market by Application, 2026-2036 (US$ Mn, AGR (%))
Figure 84 North America Small Drones Market Share Forecast by Application, 2026 & 2036 (%)
Figure 85 North America Small Drones Market by Payload Type, 2026-2036 (US$ Mn, AGR (%))
Figure 86 North America Small Drones Market Share Forecast by Payload Type, 2026 & 2036 (%)
Figure 87 US Small Drones Market by Value, 2026-2036 (US$ Mn, AGR (%))
Figure 88 Canada Small Drones Market by Value, 2026-2036 (US$ Mn, AGR (%))
Figure 89 Europe Small Drones Market Attractiveness Index
Figure 90 Europe Small Drones Market by Region, 2026, 2031 & 2036 (US$ Million)
Figure 91 Europe Small Drones Market by Country, 2026-2036 (US$ Mn, AGR (%))
Figure 92 Europe Small Drones Market Share Forecast by Country, 2026 & 2036 (%)
Figure 93 Europe Small Drones Market by Propulsion, 2026-2036 (US$ Mn, AGR (%))
Figure 94 Europe Small Drones Market Share Forecast by Propulsion, 2026 & 2036 (%)
Figure 95 Europe Small Drones Market by Platform, 2026-2036 (US$ Mn, AGR (%))
Figure 96 Europe Small Drones Market Share Forecast by Platform, 2026 & 2036 (%)
Figure 97 Europe Small Drones Market by Maximum Take-off Weight (MTOW), 2026-2036 (US$ Mn, AGR (%))
Figure 98 Europe Small Drones Market Share Forecast by Maximum Take-off Weight (MTOW), 2026 & 2036 (%)
Figure 99 Europe Small Drones Market by Application, 2026-2036 (US$ Mn, AGR (%))
Figure 100 Europe Small Drones Market Share Forecast by Application, 2026 & 2036 (%)
Figure 101 Europe Small Drones Market by Payload Type, 2026-2036 (US$ Mn, AGR (%))
Figure 102 Europe Small Drones Market Share Forecast by Payload Type, 2026 & 2036 (%)
Figure 103 Germany Small Drones Market by Value, 2026-2036 (US$ Mn, AGR (%))
Figure 104 UK Small Drones Market by Value, 2026-2036 (US$ Mn, AGR (%))
Figure 105 France Small Drones Market by Value, 2026-2036 (US$ Mn, AGR (%))
Figure 106 Italy Small Drones Market by Value, 2026-2036 (US$ Mn, AGR (%))
Figure 107 Spain Small Drones Market by Value, 2026-2036 (US$ Mn, AGR (%))
Figure 108 Rest of Europe Small Drones Market by Value, 2026-2036 (US$ Mn, AGR (%))
Figure 109 Asia-Pacific Small Drones Market Attractiveness Index
Figure 110 Asia-Pacific Small Drones Market by Region, 2026, 2031 & 2036 (US$ Million)
Figure 111 Asia-Pacific Small Drones Market by Country, 2026-2036 (US$ Mn, AGR (%))
Figure 112 Asia-Pacific Small Drones Market Share Forecast by Country, 2026 & 2036 (%)
Figure 113 Asia-Pacific Small Drones Market by Propulsion, 2026-2036 (US$ Mn, AGR (%))
Figure 114 Asia-Pacific Small Drones Market Share Forecast by Propulsion, 2026 & 2036 (%)
Figure 115 Asia-Pacific Small Drones Market by Platform, 2026-2036 (US$ Mn, AGR (%))
Figure 116 Asia-Pacific Small Drones Market Share Forecast by Platform, 2026 & 2036 (%)
Figure 117 Asia-Pacific Small Drones Market by Maximum Take-off Weight (MTOW), 2026-2036 (US$ Mn, AGR (%))
Figure 118 Asia-Pacific Small Drones Market Share Forecast by Maximum Take-off Weight (MTOW), 2026 & 2036 (%)
Figure 119 Asia-Pacific Small Drones Market by Application, 2026-2036 (US$ Mn, AGR (%))
Figure 120 Asia-Pacific Small Drones Market Share Forecast by Application, 2026 & 2036 (%)
Figure 121 Asia-Pacific Small Drones Market by Payload Type, 2026-2036 (US$ Mn, AGR (%))
Figure 122 Asia-Pacific Small Drones Market Share Forecast by Payload Type, 2026 & 2036 (%)
Figure 123 China Small Drones Market by Value, 2026-2036 (US$ Mn, AGR (%))
Figure 124 India Small Drones Market by Value, 2026-2036 (US$ Mn, AGR (%))
Figure 125 Japan Small Drones Market by Value, 2026-2036 (US$ Mn, AGR (%))
Figure 126 South Korea Small Drones Market by Value, 2026-2036 (US$ Mn, AGR (%))
Figure 127 Australia Small Drones Market by Value, 2026-2036 (US$ Mn, AGR (%))
Figure 128 Rest of Asia-Pacific Small Drones Market by Value, 2026-2036 (US$ Mn, AGR (%))
Figure 129 Middle East and Africa Small Drones Market Attractiveness Index
Figure 130 Middle East and Africa Small Drones Market by Region, 2026, 2031 & 2036 (US$ Million)
Figure 131 Middle East & Africa Small Drones Market by Country, 2026-2036 (US$ Mn, AGR (%))
Figure 132 Middle East and Africa Small Drones Market Share Forecast by Country, 2026 & 2036 (%)
Figure 133 Middle East & Africa Small Drones Market by Propulsion, 2026-2036 (US$ Mn, AGR (%))
Figure 134 Middle East and Africa Small Drones Market Share Forecast by Propulsion, 2026 & 2036 (%)
Figure 135 Middle East & Africa Small Drones Market by Platform, 2026-2036 (US$ Mn, AGR (%))
Figure 136 Middle East and Africa Small Drones Market Share Forecast by Platform, 2026 & 2036 (%)
Figure 137 Middle East & Africa Small Drones Market by Maximum Take-off Weight (MTOW), 2026-2036 (US$ Mn, AGR (%))
Figure 138 Middle East and Africa Small Drones Market Share Forecast by Maximum Take-off Weight (MTOW), 2026 & 2036 (%)
Figure 139 Middle East & Africa Small Drones Market by Application, 2026-2036 (US$ Mn, AGR (%))
Figure 140 Middle East and Africa Small Drones Market Share Forecast by Application, 2026 & 2036 (%)
Figure 141 Middle East & Africa Small Drones Market by Payload Type, 2026-2036 (US$ Mn, AGR (%))
Figure 142 Middle East and Africa Small Drones Market Share Forecast by Payload Type, 2026 & 2036 (%)
Figure 143 GCC Small Drones Market by Value, 2026-2036 (US$ Mn, AGR (%))
Figure 144 Israel Small Drones Market by Value, 2026-2036 (US$ Mn, AGR (%))
Figure 145 Rest of Middle East & Africa Small Drones Market by Value, 2026-2036 (US$ Mn, AGR (%))
Figure 146 Latin America Small Drones Market Attractiveness Index
Figure 147 Latin America Small Drones Market by Region, 2026, 2031 & 2036 (US$ Million)
Figure 148 Latin America Small Drones Market by Country, 2026-2036 (US$ Mn, AGR (%))
Figure 149 Latin America Small Drones Market Share Forecast by Country, 2026 & 2036 (%)
Figure 150 Latin America Small Drones Market by Propulsion, 2026-2036 (US$ Mn, AGR (%))
Figure 151 Latin America Small Drones Market Share Forecast by Propulsion, 2026 & 2036 (%)
Figure 152 Latin America Small Drones Market by Platform, 2026-2036 (US$ Mn, AGR (%))
Figure 153 Latin America Small Drones Market Share Forecast by Platform, 2026 & 2036 (%)
Figure 154 Latin America Small Drones Market by Maximum Take-off Weight (MTOW), 2026-2036 (US$ Mn, AGR (%))
Figure 155 Latin America Small Drones Market Share Forecast by Maximum Take-off Weight (MTOW), 2026 & 2036 (%)
Figure 156 Latin America Small Drones Market by Application, 2026-2036 (US$ Mn, AGR (%))
Figure 157 Latin America Small Drones Market Share Forecast by Application, 2026 & 2036 (%)
Figure 158 Latin America Small Drones Market by Payload Type, 2026-2036 (US$ Mn, AGR (%))
Figure 159 Latin America Small Drones Market Share Forecast by Payload Type, 2026 & 2036 (%)
Figure 160 Brazil Small Drones Market by Value, 2026-2036 (US$ Mn, AGR (%))
Figure 161 Mexico Small Drones Market by Value, 2026-2036 (US$ Mn, AGR (%))
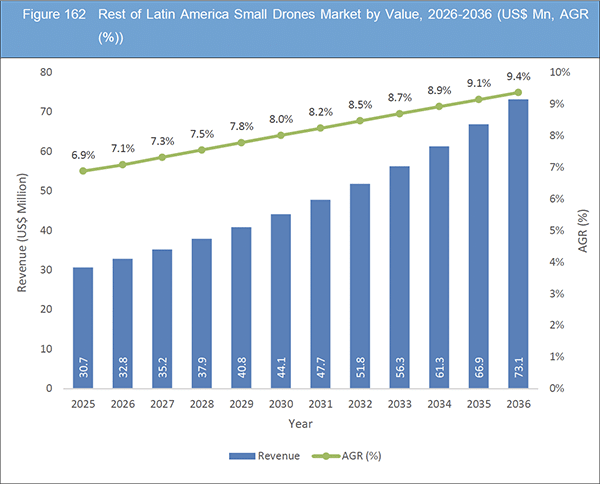
Figure 162 Rest of Latin America Small Drones Market by Value, 2026-2036 (US$ Mn, AGR (%))
Figure 163 Small Drones Market: Company Share (%), 2024
Figure 164 DJI (Da-Jing Innovations): SWOT Analysis
Figure 165 AeroVironment: Net Revenue, 2020-2024 (US$ Million, AGR%)
Figure 166 AeroVironment: R&D, 2020-2024 (US$ Million, AGR%)
Figure 167 AeroVironment: Regional Market Shares (%), 2024
Figure 168 AeroVironment: Business Segment Market Shares (%), 2024
Figure 169 AeroVironment: SWOT Analysis
Figure 170 Skydio: SWOT Analysis
Figure 171 Parrot: Net Revenue, 2020-2024 (US$ Million, AGR%)
Figure 172 Parrot: Business Segment Market Shares (%), 2024
Figure 173 Parrot: SWOT Analysis
Figure 174 Autel Robotics: SWOT Analysis
Figure 175 Teledyne FLIR: Net Revenue, 2020-2024 (US$ Million, AGR%)
Figure 176 Teledyne FLIR: R&D, 2020-2024 (US$ Million, AGR%)
Figure 177 Teledyne FLIR: Regional Market Shares (%), 2024
Figure 178 Teledyne FLIR: Business Segment Market Shares (%), 2024
Figure 179 Teledyne FLIR: SWOT Analysis
Figure 180 Elbit Systems: Net Revenue, 2020-2024 (US$ Million, AGR%)
Figure 181 Elbit Systems: R&D, 2020-2024 (US$ Million, AGR%)
Figure 182 Elbit Systems: Regional Market Shares (%), 2024
Figure 183 Elbit Systems: Business Segment Market Shares (%), 2024
Figure 184 Elbit Systems: SWOT Analysis
Figure 185 Israel Aerospace Industries: Net Revenue, 2020-2024 (US$ Million, AGR%)
Figure 186 Israel Aerospace Industries: R&D, 2020-2024 (US$ Million, AGR%)
Figure 187 Israel Aerospace Industries: Regional Market Shares (%), 2024
Figure 188 Israel Aerospace Industries: Business Segment Market Shares (%), 2024
Figure 189 Israel Aerospace Industries: SWOT Analysis
Figure 190 Northrop Grumman: Net Revenue, 2020-2024 (US$ Million, AGR%)
Figure 191 Northrop Grumman: R&D, 2020-2024 (US$ Million, AGR%)
Figure 192 Northrop Grumman: Regional Market Shares (%), 2024
Figure 193 Northrop Grumman: Business Segment Market Shares (%), 2024
Figure 194 Northrop Grumman: SWOT Analysis
Figure 195 Lockheed Martin: Net Revenue, 2020-2024 (US$ Million, AGR%)
Figure 196 Lockheed Martin: R&D, 2020-2024 (US$ Million, AGR%)
Figure 197 Lockheed Martin: Regional Market Shares (%), 2024
Figure 198 Lockheed Martin: Business Segment Market Shares (%), 2024
Figure 199 Lockheed Martin: SWOT Analysis
Figure 200 BAE Systems plc: Net Revenue, 2020-2024 (US$ Million, AGR%)
Figure 201 BAE Systems plc: R&D, 2020-2024 (US$ Million, AGR%)
Figure 202 BAE Systems plc: Regional Market Shares (%), 2024
Figure 203 BAE Systems plc: Business Segment Market Shares (%), 2024
Figure 204 BAE Systems plc: SWOT Analysis
Figure 205 Saab AB: Net Revenue, 2020-2024 (US$ Million, AGR%)
Figure 206 Saab AB: R&D, 2020-2024 (US$ Million, AGR%)
Figure 207 Saab AB: Regional Market Shares (%), 2024
Figure 208 Saab AB: Business Segment Market Shares (%), 2024
Figure 209 Saab AB: SWOT Analysis
Figure 210 Rheinmetall: Net Revenue, 2020-2024 (US$ Million, AGR%)
Figure 211 Rheinmetall: R&D, 2020-2024 (US$ Million, AGR%)
Figure 212 Rheinmetall: Regional Market Shares (%), 2024
Figure 213 Rheinmetall: Business Segment Market Shares (%), 2024
Figure 214 Rheinmetall: SWOT Analysis
Figure 215 Thales Group: Net Revenue, 2020-2024 (US$ Million, AGR%)
Figure 216 Thales Group: R&D, 2020-2024 (US$ Million, AGR%)
Figure 217 Thales Group: Regional Market Shares (%), 2024
Figure 218 Thales Group: Business Segment Market Shares (%), 2024
Figure 219 Thales Group: SWOT Analysis
Figure 220 Quantum-Systems: SWOT Analysis
Figure 221 Uvision Air Ltd.: SWOT Analysis
Figure 222 UVify: SWOT Analysis
Figure 223 Delair: SWOT Analysis
Figure 224 IdeaForge: Net Revenue, 2020-2024 (US$ Million, AGR%)
Figure 225 IdeaForge: Business Segment Market Shares (%), 2024
Figure 226 ideaForge: SWOT Analysis
Figure 227 Asteria Aerospace: SWOT Analysis
Figure 228 Edge Autonomy: SWOT Analysis
Figure 229 EHang: Net Revenue, 2020-2024 (US$ Million, AGR%)
Figure 230 EHang: SWOT Analysis
Figure 231 Yuneec: SWOT Analysis
Figure 232 Wingtra: SWOT Analysis
Figure 233 General Atomics Aeronautical Systems: SWOT Analysis
ページTOPに戻る
Summary
Description
Visiongain has published a new report, Small Drones Market Report 2026-2036, providing a comprehensive analysis of the global market, including market size, growth drivers, competitive positioning, and revenue forecasts across key drone applications, technologies, and end users.
The global small drones market is expected to expand from US$4.8bn in 2026 to US$13.7bn by 2036, at a 11.1% CAGR. This is due to a surge in demand across defence, commercial, and public safety sectors, where advances in autonomy, imaging systems, and data analytics are enabling drones to perform increasingly complex missions.
Technological Innovation Driving Market Expansion
Rapid technological progress in autonomous flight systems, sensor integration, and artificial intelligence is reshaping the competitive landscape within the small drones industry. Continued development of advanced navigation systems, obstacle avoidance technologies, and automated flight management is enabling drones to operate with greater independence and reliability across complex operational environments.
Artificial intelligence-enabled analytics platforms are also transforming how drone-generated data is processed and utilised. Machine learning systems are increasingly used for automated image recognition, object detection, and infrastructure analysis, allowing drones to deliver actionable insights rather than simply collecting aerial imagery. These capabilities are attracting strong interest from both defence organisations and commercial industries seeking to improve operational efficiency and decision-making.
Significant investment is also supporting the development of new drone applications across industries including energy, agriculture, logistics, and infrastructure management. As drone hardware becomes more capable and software platforms more sophisticated, the integration of drones into routine operational workflows is expected to expand across multiple sectors.
Trade and Supply Chain Dynamics
Supply chains are evolving as drone manufacturers manage access to critical components, including semiconductors, sensors, imaging systems, and battery technologies. These inputs are often sourced globally, making production sensitive to changes in availability, cost, and sourcing strategy.
Rising input costs and supply constraints are influencing manufacturing economics and procurement decisions across the industry. Companies operating in highly competitive markets are balancing pricing pressures with the need to maintain performance and reliability.
In response, manufacturers are diversifying supply chains, investing in regional production capabilities, and strengthening supplier networks to improve resilience. These adjustments are expected to reshape production models, cost structures, and long-term sourcing strategies across the global drone market.
Key Questions Answered in This Report
-
What is the projected size of the small drones market by 2036?
-
Which application segments will generate the strongest growth?
-
How will autonomous technologies influence the evolution of drone capabilities?
-
Which regions and national markets will lead adoption during the forecast period?
-
How will U.S. trade tariffs influence drone supply chains and manufacturing strategies?
-
Who are the leading companies, and how will their competitive positions evolve?
Report Scope and Data Coverage
-
Comprehensive analysis of the global small drones market
-
Revenue forecasts to 2036
-
Segment-level modelling across multiple technology and application categories
-
Regional and national market analysis
-
Competitive profiling of leading drone manufacturers and technology providers
Includes quantitative forecasting and qualitative analysis covering market dynamics, growth drivers, competitive landscape, technology developments, and strategic industry trends.
Segmentation Framework
By Propulsion
-
Electric Propulsion
-
Hybrid/Gasoline Propulsion
By Platform
-
Rotary-Wing (Multirotor)
-
Fixed-Wing
-
Hybrid VTOL
By Maximum Takeoff Weight (MTOW)
-
<250 g
-
250 g–2 kg
-
2–10 kg
-
10–25 kg
By Application
-
Security & Surveillance (ISR)
-
Aerial Imaging & Surveying
-
Inspection & Monitoring
-
Agriculture
-
Other Applications
By Payload Type
-
Optical Payloads
-
LiDAR Payloads
-
SIGINT / EW Payloads
-
Thermal Imaging Payloads
-
Multispectral Payloads
-
Hyperspectral Payloads
Geographic Coverage
In addition to the revenue predictions for the overall world market and segments, you will also find revenue forecasts for five regional and 20 leading national markets:
North America
Europe
-
Germany
-
UK
-
France
-
Italy
-
Spain
-
Rest of Europe
Asia Pacific
-
Japan
-
China
-
India
-
Australia
-
South Korea
-
Rest of Asia Pacific
Latin America
-
Brazil
-
Mexico
-
Rest of Latin America
MEA
-
GCC
-
South Africa
-
Rest of MEA
Company Intelligence
Competitive analysis profiles 20+ major participants, including:
-
AeroVironment
-
Asteria Aerospace
-
Autel Robotics
-
BAE Systems plc
-
Delair
-
DJI (Da-Jiang Innovations)
-
Edge Autonomy
-
EHang
-
Elbit Systems
-
General Atomics Aeronautical Systems
-
ideaForge
-
Israel Aerospace Industries
-
Lockheed Martin
-
Northrop Grumman
-
Parrot
-
Quantum-Systems
-
Rheinmetall
-
Saab AB
-
Skydio
-
Teledyne FLIR
-
Thales Group
-
UVify
-
Uvision Air Ltd.
-
Wingtra
-
Yuneec
Profiles assess capabilities, pipeline positioning, strategic developments and commercial outlook.
How will the Small Drone Market, 2026 to 2036 report help you?
In summary, our 480+ page report provides you with the following knowledge:
-
Revenue forecasts to 2036 for Small Drone Market, 2026 to 2036, with forecasts for propulsion, platform, maximum takeoff weight (MTOW), application, and payload type, each forecast at a global and regional level – discover the industry’s prospects, finding the most lucrative places for investments and revenues.
-
Revenue forecasts to 2036 for five regional and 25 key national markets – See forecasts for the Small Drone Market, 2026 to 2036 in North America, Europe, Asia Pacific, Latin America, and MEA. Also forecasted is the market in the US, Canada, Mexico, Brazil, Germany, France, UK, Italy, China, India, Japan, and Australia among other prominent economies.
-
Prospects for established firms and those seeking to enter the market – including company profiles for 25 of the major companies involved in the Small Drone Market, 2026 to 2036.
Why This Market Intelligence Matters
The small drones market is evolving rapidly as advances in autonomy, sensor technology, and data analytics expand the operational value of unmanned aerial systems. Defence organisations, commercial enterprises, and public sector agencies are increasingly integrating drones into routine operations to improve situational awareness, efficiency, and safety.
Companies that understand evolving regulatory frameworks, technology developments, and supply chain risks will be better positioned to capture long-term opportunities in the global small drones market through 2036.
ページTOPに戻る
Table of Contents
1 Report Overview
1.1 Objectives of the Study
1.2 Introduction to Small Drones Market
1.3 What This Report Delivers
1.4 Why You Should Read This Report
1.5 Key Questions Answered by This Analytical Report
1.6 Who is This Report for?
1.7 Methodology
1.7.1 Market Definitions
1.7.2 Market Evaluation & Forecasting Methodology
1.7.3 Data Validation
1.7.3.1 Primary Research
1.7.3.2 Secondary Research
1.8 Frequently Asked Questions (FAQs)
1.9 Associated Visiongain Reports
1.10 About Visiongain
2 Executive Summary
3 Market Overview
3.1 Key Findings
3.2 Market Dynamics
3.3 Impact Analysis
3.3.1 Market Driving Factors
3.3.1.1 Military & Homeland Security Demand Driving the Small Drone Market Growth
3.3.1.2 Regulatory Evolution Supporting Adoption Driving the Market Growth
3.3.1.3 Rise of Precision Agriculture Driving the Market Growth
3.3.2 Market Restraining Factors
3.3.2.1 Limited Flight Endurance & Payload Constraints Restrain the Market Growth
3.3.2.2 Weather Dependency & Operational Risks Hinder the Maret Growth
3.3.3 Market Opportunities
3.3.3.1 Expansion of Commercial and Civilian Applications Opportunities for Market Growth
3.3.3.2 Significant Investment in the Small Drone Opportunities for Market Growth
3.3.3.3 Collaboration and Partnership Between Market Players Opportunities for the Market Growth
3.4 U.S. Tariffs: What’s the Impact on the Global Small Drones Market?
3.4.1 Overview
3.4.2 V-Shaped Recovery Scenario
3.4.2.1 Why V-Shaped Recovery?
3.4.2.2 Impact from Tariffs
3.4.2.3 Market Dynamics and Demand Recovery
3.4.2.4 Policy and Funding Support
3.4.2.5 Timeframe for Recovery
3.4.3 U-Shaped Recovery Scenario
3.4.3.1 Why U-Shaped Recovery?
3.4.3.2 Impact from Tariffs
3.4.3.3 Market Dynamics and Demand Recovery
3.4.3.4 Policy and Funding Support
3.4.3.5 Timeframe for Recovery
3.4.4 L-Shaped Recovery Scenario
3.4.4.1 Why L-Shaped Recovery?
3.4.4.2 Impact from Tariffs
3.4.4.3 Market Dynamics and Demand Recovery
3.4.4.4 Policy and Funding Support
3.4.4.5 Timeframe for Recovery
3.4.5 What Strategic Considerations Should Clients Factor into Their Near-term (2026–2031) and Long-term (2026–2036) Planning?
3.4.6 Impact of the U.S. and China Trade War on the Small Drones Market
3.4.7 How Might the Most Impacted Countries Experience Positive and Negative Effects Resulting from These Policy Changes?
3.5 Porter’s Five Forces Analysis
3.5.1 Bargaining Power of Suppliers – High
3.5.2 Bargaining Power of Buyers – Medium
3.5.3 Competitive Rivalry- High
3.5.4 Threat of Substitutes- Low
3.5.5 Threat of New Entrants-Medium
3.6 PESTLE Analysis
4 Small Drones Market Analysis by Propulsion
4.1 Key Findings
4.2 Propulsion Segment: Market Attractiveness Index
4.3 Small Drones Market Size Estimation and Forecast by Propulsion
4.4 Electric Propulsion
4.4.1 Market Size by Region, 2026-2036 (US$ Million)
4.4.2 Market Share by Region, 2026 & 2036 (%)
4.5 Hybrid/ Gasoline Propulsion
4.5.1 Market Size by Region, 2026-2036 (US$ Million)
4.5.2 Market Share by Region, 2026 & 2036 (%)
5 Small Drones Market Analysis by Platform
5.1 Key Findings
5.2 Platform Segment: Market Attractiveness Index
5.3 Small Drones Market Size Estimation and Forecast by Platform
5.4 Rotary-Wing (Multirotor)
5.4.1 Market Size by Region, 2026-2036 (US$ Million)
5.4.2 Market Share by Region, 2026 & 2036 (%)
5.5 Fixed-Wing
5.5.1 Market Size by Region, 2026-2036 (US$ Million)
5.5.2 Market Share by Region, 2026 & 2036 (%)
5.6 Hybrid VTOL
5.6.1 Market Size by Region, 2026-2036 (US$ Million)
5.6.2 Market Share by Region, 2026 & 2036 (%)
6 Small Drones Market Analysis by Maximum Take-off Weight (MTOW)
6.1 Key Findings
6.2 Maximum Take-off Weight (MTOW) Segment: Market Attractiveness Index
6.3 Small Drones Market Size Estimation and Forecast by Maximum Take-off Weight (MTOW)
6.4 <250 g
6.4.1 Market Size by Region, 2026-2036 (US$ Million)
6.4.2 Market Share by Region, 2026 & 2036 (%)
6.5 250 g–2 kg
6.5.1 Market Size by Region, 2026-2036 (US$ Million)
6.5.2 Market Share by Region, 2026 & 2036 (%)
6.6 2–10 kg
6.6.1 Market Size by Region, 2026-2036 (US$ Million)
6.6.2 Market Share by Region, 2026 & 2036 (%)
6.7 10–25 kg
6.7.1 Market Size by Region, 2026-2036 (US$ Million)
6.7.2 Market Share by Region, 2026 & 2036 (%)
7 Small Drones Market Analysis by Application
7.1 Key Findings
7.2 Application Segment: Market Attractiveness Index
7.3 Small Drones Market Size Estimation and Forecast by Application
7.4 Security & Surveillance (ISR)
7.4.1 Market Size by Region, 2026-2036 (US$ Million)
7.4.2 Market Share by Region, 2026 & 2036 (%)
7.5 Aerial Imaging & Surveying
7.5.1 Market Size by Region, 2026-2036 (US$ Million)
7.5.2 Market Share by Region, 2026 & 2036 (%)
7.6 Inspection & Monitoring
7.6.1 Market Size by Region, 2026-2036 (US$ Million)
7.6.2 Market Share by Region, 2026 & 2036 (%)
7.7 Agriculture
7.7.1 Market Size by Region, 2026-2036 (US$ Million)
7.7.2 Market Share by Region, 2026 & 2036 (%)
7.8 Other Applications
7.8.1 Market Size by Region, 2026-2036 (US$ Million)
7.8.2 Market Share by Region, 2026 & 2036 (%)
8 Small Drones Market Analysis by Payload Type
8.1 Key Findings
8.2 Payload Type Segment: Market Attractiveness Index
8.3 Small Drones Market Size Estimation and Forecast by Payload Type
8.4 Optical Payloads
8.4.1 Market Size by Region, 2026-2036 (US$ Million)
8.4.2 Market Share by Region, 2026 & 2036 (%)
8.5 LiDAR Payloads
8.5.1 Market Size by Region, 2026-2036 (US$ Million)
8.5.2 Market Share by Region, 2026 & 2036 (%)
8.6 SIGINT / EW Payloads
8.6.1 Market Size by Region, 2026-2036 (US$ Million)
8.6.2 Market Share by Region, 2026 & 2036 (%)
8.7 Thermal Imaging Payloads
8.7.1 Market Size by Region, 2026-2036 (US$ Million)
8.7.2 Market Share by Region, 2026 & 2036 (%)
8.8 Multispectral Payloads
8.8.1 Market Size by Region, 2026-2036 (US$ Million)
8.8.2 Market Share by Region, 2026 & 2036 (%)
8.9 Hyperspectral Payloads
8.9.1 Market Size by Region, 2026-2036 (US$ Million)
8.9.2 Market Share by Region, 2026 & 2036 (%)
9 Small Drones Market Analysis by Region
9.1 Key Findings
9.2 Regional Market Size Estimation and Forecast
10 North America Small Drones Market Analysis
10.1 Key Findings
10.2 North America Small Drones Market Attractiveness Index
10.3 North America Small Drones Market by Country, 2026, 2031 & 2036 (US$ Million)
10.4 North America Small Drones Market Size Estimation and Forecast by Country
10.5 North America Small Drones Market Size Estimation and Forecast by Propulsion
10.6 North America Small Drones Market Size Estimation and Forecast by Platform
10.7 North America Small Drones Market Size Estimation and Forecast by Maximum Take-off Weight (MTOW)
10.8 North America Small Drones Market Size Estimation and Forecast by Application
10.9 North America Small Drones Market Size Estimation and Forecast by Payload Type
10.10 U.S. Small Drones Market Analysis
10.11 Canada Small Drones Market Analysis
11 Europe Small Drones Market Analysis
11.1 Key Findings
11.2 Europe Small Drones Market Attractiveness Index
11.3 Europe Small Drones Market by Country, 2026, 2031 & 2036 (US$ Million)
11.4 Europe Small Drones Market Size Estimation and Forecast by Country
11.5 Europe Small Drones Market Size Estimation and Forecast by Propulsion
11.6 Europe Small Drones Market Size Estimation and Forecast by Platform
11.7 Europe Small Drones Market Size Estimation and Forecast by Maximum Take-off Weight (MTOW)
11.8 Europe Small Drones Market Size Estimation and Forecast by Application
11.9 Europe Small Drones Market Size Estimation and Forecast by Payload Type
11.10 Germany Small Drones Market Analysis
11.11 UK Small Drones Market Analysis
11.12 France Small Drones Market Analysis
11.13 Italy Small Drones Market Analysis
11.14 Spain Small Drones Market Analysis
11.15 Rest of Europe Small Drones Market Analysis
12 Asia-Pacific Small Drones Market Analysis
12.1 Key Findings
12.2 Asia-Pacific Small Drones Market Attractiveness Index
12.3 Asia-Pacific Small Drones Market by Country, 2026, 2031 & 2036 (US$ Million)
12.4 Asia-Pacific Small Drones Market Size Estimation and Forecast by Country
12.5 Asia-Pacific Small Drones Market Size Estimation and Forecast by Propulsion
12.6 Asia-Pacific Small Drones Market Size Estimation and Forecast by Platform
12.7 Asia-Pacific Small Drones Market Size Estimation and Forecast by Maximum Take-off Weight (MTOW)
12.8 Asia-Pacific Small Drones Market Size Estimation and Forecast by Application
12.9 Asia-Pacific Small Drones Market Size Estimation and Forecast by Payload Type
12.10 China Small Drones Market Analysis
12.11 India Small Drones Market Analysis
12.12 Japan Small Drones Market Analysis
12.13 South Korea Small Drones Market Analysis
12.14 Australia Small Drones Market Analysis
12.15 Rest of Asia-Pacific Small Drones Market Analysis
13 Middle East and Africa Small Drones Market Analysis
13.1 Key Findings
13.2 Middle East and Africa Small Drones Market Attractiveness Index
13.3 Middle East and Africa Small Drones Market by Country, 2026, 2031 & 2036 (US$ Million)
13.4 Middle East and Africa Small Drones Market Size Estimation and Forecast by Country
13.5 Middle East and Africa Small Drones Market Size Estimation and Forecast by Propulsion
13.6 Middle East and Africa Small Drones Market Size Estimation and Forecast by Platform
13.7 Middle East and Africa Small Drones Market Size Estimation and Forecast by Maximum Take-off Weight (MTOW)
13.8 Middle East and Africa Small Drones Market Size Estimation and Forecast by Application
13.9 Middle East and Africa Small Drones Market Size Estimation and Forecast by Payload Type
13.10 GCC Small Drones Market Analysis
13.11 Israel Small Drones Market Analysis
13.12 Rest of the Middle East and Africa Small Drones Market Analysis
14 Latin America Small Drones Market Analysis
14.1 Key Findings
14.2 Latin America Small Drones Market Attractiveness Index
14.3 Latin America Small Drones Market by Country, 2026, 2031 & 2036 (US$ Million)
14.4 Latin America Small Drones Market Size Estimation and Forecast by Country
14.5 Latin America Small Drones Market Size Estimation and Forecast by Propulsion
14.6 Latin America Small Drones Market Size Estimation and Forecast by Platform
14.7 Latin America Small Drones Market Size Estimation and Forecast by Maximum Take-off Weight (MTOW)
14.8 Latin America Small Drones Market Size Estimation and Forecast by Application
14.9 Latin America Small Drones Market Size Estimation and Forecast by Payload Type
14.10 Brazil Small Drones Market Analysis
14.11 Mexico Small Drones Market Analysis
14.12 Rest of Latin America Small Drones Market Analysis
15 Company Profiles
15.1 Competitive Landscape Analysis, 2024
15.2 Strategic Outlook
15.3 DJI (Da-Jiang Innovations)
15.3.1 Company Snapshot
15.3.2 Company Overview
15.3.3 Product Benchmarking
15.3.4 Strategic Outlook
15.3.5 SWOT Analysis
15.4 AeroVironment
15.4.1 Company Snapshot
15.4.2 Company Overview
15.4.3 Financial Analysis
15.4.3.1 Net Revenue, 2020-2024
15.4.3.2 R&D, 2020-2024
15.4.3.3 Regional Market Shares, 2024
15.4.3.4 Business Segment Market Shares, 2024
15.4.4 Product Benchmarking
15.4.5 Strategic Outlook
15.4.6 SWOT Analysis
15.5 Skydio
15.5.1 Company Snapshot
15.5.2 Company Overview
15.5.3 Product Benchmarking
15.5.4 Strategic Outlook
15.5.5 SWOT Analysis
15.6 Parrot
15.6.1 Company Snapshot
15.6.2 Company Overview
15.6.3 Financial Analysis
15.6.3.1 Net Revenue, 2020-2024
15.6.3.2 Business Segment Market Shares, 2024
15.6.4 Product Benchmarking
15.6.5 Strategic Outlook
15.6.6 SWOT Analysis
15.7 Autel Robotics
15.7.1 Company Snapshot
15.7.2 Company Overview
15.7.3 Product Benchmarking
15.7.4 Strategic Outlook
15.7.5 SWOT Analysis
15.8 Teledyne FLIR
15.8.1 Company Snapshot
15.8.2 Company Overview
15.8.3 Financial Analysis
15.8.3.1 Net Revenue, 2020-2024
15.8.3.2 R&D, 2020-2024
15.8.3.3 Regional Market Shares, 2024
15.8.3.4 Business Segment Market Shares, 2024
15.8.4 Product Benchmarking
15.8.5 Strategic Outlook
15.8.6 SWOT Analysis
15.9 Elbit Systems
15.9.1 Company Snapshot
15.9.2 Company Overview
15.9.3 Financial Analysis
15.9.3.1 Net Revenue, 2020-2024
15.9.3.2 R&D, 2020-2024
15.9.3.3 Regional Market Shares, 2024
15.9.3.4 Business Segment Market Shares, 2024
15.9.4 Product Benchmarking
15.9.5 Strategic Outlook
15.9.6 SWOT Analysis
15.10 Israel Aerospace Industries
15.10.1 Company Snapshot
15.10.2 Company Overview
15.10.3 Financial Analysis
15.10.3.1 Net Revenue, 2020-2024
15.10.3.2 R&D, 2020-2024
15.10.3.3 Regional Market Shares, 2024
15.10.3.4 Business Segment Market Shares, 2024
15.10.4 Product Benchmarking
15.10.5 Strategic Outlook
15.10.6 SWOT Analysis
15.11 Northrop Grumman
15.11.1 Company Snapshot
15.11.2 Company Overview
15.11.3 Financial Analysis
15.11.3.1 Net Revenue, 2020-2024
15.11.3.2 R&D, 2020-2024
15.11.3.3 Regional Market Shares, 2024
15.11.3.4 Business Segment Market Shares, 2024
15.11.4 Product Benchmarking
15.11.5 Strategic Outlook
15.11.6 SWOT Analysis
15.12 Lockheed Martin
15.12.1 Company Snapshot
15.12.2 Company Overview
15.12.3 Financial Analysis
15.12.3.1 Net Revenue, 2020-2024
15.12.3.2 R&D, 2020-2024
15.12.3.3 Regional Market Shares, 2024
15.12.3.4 Business Segment Market Shares, 2024
15.12.4 Product Benchmarking
15.12.5 Strategic Outlook
15.12.6 SWOT Analysis
15.13 BAE Systems plc
15.13.1 Company Snapshot
15.13.2 Company Overview
15.13.3 Financial Analysis
15.13.3.1 Net Revenue, 2020-2024
15.13.3.2 R&D, 2020-2024
15.13.3.3 Regional Market Shares, 2024
15.13.3.4 Business Segment Market Shares, 2024
15.13.4 Product Benchmarking
15.13.5 Strategic Outlook
15.13.6 SWOT Analysis
15.14 Saab AB
15.14.1 Company Snapshot
15.14.2 Company Overview
15.14.3 Product Benchmarking
15.14.4 Financial Analysis
15.14.4.1 Net Revenue, 2020-2024
15.14.4.2 R&D, 2020-2024
15.14.4.3 Regional Market Shares, 2024
15.14.4.4 Business Segment Market Shares, 2024
15.14.5 Strategic Outlook
15.14.6 SWOT Analysis
15.15 Rheinmetall
15.15.1 Company Snapshot
15.15.2 Company Overview
15.15.3 Financial Analysis
15.15.3.1 Net Revenue, 2020-2024
15.15.3.2 R&D, 2020-2024
15.15.3.3 Regional Market Shares, 2024
15.15.3.4 Business Segment Market Shares, 2024
15.15.4 Product Benchmarking
15.15.5 Strategic Outlook
15.15.6 SWOT Analysis
15.16 Thales Group
15.16.1 Company Snapshot
15.16.2 Company Overview
15.16.3 Financial Analysis
15.16.3.1 Net Revenue, 2020-2024
15.16.3.2 R&D, 2020-2024
15.16.3.3 Regional Market Shares, 2024
15.16.3.4 Business Segment Market Shares, 2024
15.16.4 Product Benchmarking
15.16.5 Strategic Outlook
15.16.6 SWOT Analysis
15.17 Quantum-Systems
15.17.1 Company Snapshot
15.17.2 Company Overview
15.17.3 Product Benchmarking
15.17.4 Strategic Outlook
15.17.5 SWOT Analysis
15.18 Uvision Air Ltd.
15.18.1 Company Snapshot
15.18.2 Company Overview
15.18.3 Product Benchmarking
15.18.4 Strategic Outlook
15.18.5 SWOT Analysis
15.19 UVify
15.19.1 Company Snapshot
15.19.2 Company Overview
15.19.3 Product Benchmarking
15.19.4 Strategic Outlook
15.19.5 SWOT Analysis
15.20 Delair
15.20.1 Company Snapshot
15.20.2 Company Overview
15.20.3 Product Benchmarking
15.20.4 Strategic Outlook
15.20.5 SWOT Analysis
15.21 ideaForge
15.21.1 Company Snapshot
15.21.2 Company Overview
15.21.3 Financial Analysis
15.21.3.1 Net Revenue, 2020-2024
15.21.3.2 Business Segment Market Shares, 2024
15.21.4 Product Benchmarking
15.21.5 Strategic Outlook
15.21.6 SWOT Analysis
15.22 Asteria Aerospace
15.22.1 Company Snapshot
15.22.2 Company Overview
15.22.3 Product Benchmarking
15.22.4 Strategic Outlook
15.22.5 SWOT Analysis
15.23 Edge Autonomy
15.23.1 Company Snapshot
15.23.2 Company Overview
15.23.3 Product Benchmarking
15.23.4 Strategic Outlook
15.23.5 SWOT Analysis
15.24 EHang
15.24.1 Company Snapshot
15.24.2 Company Overview
15.24.3 Financial Analysis
15.24.3.1 Net Revenue, 2020-2024
15.24.4 Product Benchmarking
15.24.5 Strategic Outlook
15.24.6 SWOT Analysis
15.25 Yuneec
15.25.1 Company Snapshot
15.25.2 Company Overview
15.25.3 Product Benchmarking
15.25.4 Strategic Outlook
15.25.5 SWOT Analysis
15.26 Wingtra
15.26.1 Company Snapshot
15.26.2 Company Overview
15.26.3 Product Benchmarking
15.26.4 Strategic Outlook
15.26.5 SWOT Analysis
15.27 General Atomics Aeronautical Systems
15.27.1 Company Snapshot
15.27.2 Company Overview
15.27.3 Product Benchmarking
15.27.4 Strategic Outlook
15.27.5 SWOT Analysis
16 Conclusion and Recommendations
16.1 Concluding Remarks from Visiongain
16.2 Recommendations for Market Players
ページTOPに戻る
List of Tables/Graphs
List of Tables
Table 1 Small Drones Market Snapshot, 2026 & 2036 (US$ Million, CAGR %)
Table 2 Leading Manufacturers & Platforms for Agriculture Drone
Table 3 Leading Manufacturers & Platforms for Precision Agriculture
Table 4 Small Drones Market: International Trade Tariff Impact Recovery Scenarios Snapshot
Table 5 Global Small Drones Market by Region, 2026-2036 (US$ Mn, AGR (%), CAGR (%)), Tariff Impact V-Shaped Recovery Scenario
Table 6 Global Small Drones Market by Region, 2026-2036 (US$ Mn, AGR (%), CAGR (%)), Tariff Impact U-Shaped Recovery Scenario
Table 7 Global Small Drones Market by Region, 2026-2036 (US$ Mn, AGR (%), CAGR (%)), Tariff Impact L-Shaped Recovery Scenario
Table 8 Global Small Drones Market by Propulsion, 2026-2036 (US$ Mn, AGR (%), CAGR (%))
Table 9 Electric Propulsion Market by Region, 2026-2036 (US$ Mn, AGR (%), CAGR (%))
Table 10 Hybrid/ Gasoline Propulsion Market by Region, 2026-2036 (US$ Mn, AGR (%), CAGR (%))
Table 11 Global Small Drones Market by Platform, 2026-2036 (US$ Mn, AGR (%), CAGR (%))
Table 12 Rotary-Wing (Multirotor) Market by Region, 2026-2036 (US$ Mn, AGR (%), CAGR (%))
Table 13 Fixed-Wing Market by Region, 2026-2036 (US$ Mn, AGR (%), CAGR (%))
Table 14 Hybrid VTOL Market by Region, 2026-2036 (US$ Mn, AGR (%), CAGR (%))
Table 15 Global Small Drones Market by Maximum Take-off Weight (MTOW), 2026-2036 (US$ Mn, AGR (%), CAGR (%))
Table 16 <250 g Market by Region, 2026-2036 (US$ Mn, AGR (%), CAGR (%))
Table 17 250 g–2 kg Market by Region, 2026-2036 (US$ Mn, AGR (%), CAGR (%))
Table 18 2–10 kg Market by Region, 2026-2036 (US$ Mn, AGR (%), CAGR (%))
Table 19 10–25 kg Market by Region, 2026-2036 (US$ Mn, AGR (%), CAGR (%))
Table 20 Global Small Drones Market by Application, 2026-2036 (US$ Mn, AGR (%), CAGR (%))
Table 21 Security & Surveillance (ISR) Market by Region, 2026-2036 (US$ Mn, AGR (%), CAGR (%))
Table 22 Aerial Imaging & Surveying Market by Region, 2026-2036 (US$ Mn, AGR (%), CAGR (%))
Table 23 Inspection & Monitoring Market by Region, 2026-2036 (US$ Mn, AGR (%), CAGR (%))
Table 24 Agriculture Market by Region, 2026-2036 (US$ Mn, AGR (%), CAGR (%))
Table 25 Other Applications Market by Region, 2026-2036 (US$ Mn, AGR (%), CAGR (%))
Table 26 Global Small Drones Market by Payload Type, 2026-2036 (US$ Mn, AGR (%), CAGR (%))
Table 27 Optical Payloads Market by Region, 2026-2036 (US$ Mn, AGR (%), CAGR (%))
Table 28 LiDAR Payloads Market by Region, 2026-2036 (US$ Mn, AGR (%), CAGR (%))
Table 29 SIGINT / EW Payloads Market by Region, 2026-2036 (US$ Mn, AGR (%), CAGR (%))
Table 30 Thermal Imaging Payloads Market by Region, 2026-2036 (US$ Mn, AGR (%), CAGR (%))
Table 31 Multispectral Payloads Market by Region, 2026-2036 (US$ Mn, AGR (%), CAGR (%))
Table 32 Hyperspectral Payloads Market by Region, 2026-2036 (US$ Mn, AGR (%), CAGR (%))
Table 33 Global Small Drones Market by Region, 2026-2036 (US$ Mn, AGR (%), CAGR (%))
Table 34 North America Small Drones Market by Country, 2026-2036 (US$ Mn, AGR (%), CAGR (%))
Table 35 North America Small Drones Market by Propulsion, 2026-2036 (US$ Mn, AGR (%), CAGR (%))
Table 36 North America Small Drones Market by Platform, 2026-2036 (US$ Mn, AGR (%), CAGR (%))
Table 37 North America Small Drones Market by Maximum Take-off Weight (MTOW), 2026-2036 (US$ Mn, AGR (%), CAGR (%))
Table 38 North America Small Drones Market by Application, 2026-2036 (US$ Mn, AGR (%), CAGR (%))
Table 39 North America Small Drones Market by Payload Type, 2026-2036 (US$ Mn, AGR (%), CAGR (%))
Table 40 US Small Drones Market by Value, 2026-2036 (US$ Mn, AGR (%), CAGR (%))
Table 41 Canada Small Drones Market by Value, 2026-2036 (US$ Mn, AGR (%), CAGR (%))
Table 42 Europe Small Drones Market by Country, 2026-2036 (US$ Mn, AGR (%), CAGR (%))
Table 43 Europe Small Drones Market by Propulsion, 2026-2036 (US$ Mn, AGR (%), CAGR (%))
Table 44 Europe Small Drones Market by Platform, 2026-2036 (US$ Mn, AGR (%), CAGR (%))
Table 45 Europe Small Drones Market by Maximum Take-off Weight (MTOW), 2026-2036 (US$ Mn, AGR (%), CAGR (%))
Table 46 Europe Small Drones Market by Application, 2026-2036 (US$ Mn, AGR (%), CAGR (%))
Table 47 Europe Small Drones Market by Payload Type, 2026-2036 (US$ Mn, AGR (%), CAGR (%))
Table 48 Germany Small Drones Market by Value, 2026-2036 (US$ Mn, AGR (%), CAGR (%))
Table 49 UK Small Drones Market by Value, 2026-2036 (US$ Mn, AGR (%), CAGR (%))
Table 50 France Small Drones Market by Value, 2026-2036 (US$ Mn, AGR (%), CAGR (%))
Table 51 Italy Small Drones Market by Value, 2026-2036 (US$ Mn, AGR (%), CAGR (%))
Table 52 Spain Small Drones Market by Value, 2026-2036 (US$ Mn, AGR (%), CAGR (%))
Table 53 Rest of Europe Small Drones Market by Value, 2026-2036 (US$ Mn, AGR (%), CAGR (%))
Table 54 Asia-Pacific Small Drones Market by Country, 2026-2036 (US$ Mn, AGR (%), CAGR (%))
Table 55 Asia-Pacific Small Drones Market by Propulsion, 2026-2036 (US$ Mn, AGR (%), CAGR (%))
Table 56 Asia-Pacific Small Drones Market by Platform, 2026-2036 (US$ Mn, AGR (%), CAGR (%))
Table 57 Asia-Pacific Small Drones Market by Maximum Take-off Weight (MTOW), 2026-2036 (US$ Mn, AGR (%), CAGR (%))
Table 58 Asia-Pacific Small Drones Market by Application, 2026-2036 (US$ Mn, AGR (%), CAGR (%))
Table 59 Asia-Pacific Small Drones Market by Payload Type, 2026-2036 (US$ Mn, AGR (%), CAGR (%))
Table 60 China Small Drones Market by Value, 2026-2036 (US$ Mn, AGR (%), CAGR (%))
Table 61 India Small Drones Market by Value, 2026-2036 (US$ Mn, AGR (%), CAGR (%))
Table 62 Japan Small Drones Market by Value, 2026-2036 (US$ Mn, AGR (%), CAGR (%))
Table 63 South Korea Small Drones Market by Value, 2026-2036 (US$ Mn, AGR (%), CAGR (%))
Table 64 Australia Small Drones Market by Value, 2026-2036 (US$ Mn, AGR (%), CAGR (%))
Table 65 Rest of Asia-Pacific Small Drones Market by Value, 2026-2036 (US$ Mn, AGR (%), CAGR (%))
Table 66 Middle East & Africa Small Drones Market by Country, 2026-2036 (US$ Mn, AGR (%), CAGR (%))
Table 67 Middle East & Africa Small Drones Market by Propulsion, 2026-2036 (US$ Mn, AGR (%), CAGR (%))
Table 68 Middle East & Africa Small Drones Market by Platform, 2026-2036 (US$ Mn, AGR (%), CAGR (%))
Table 69 Middle East & Africa Small Drones Market by Maximum Take-off Weight (MTOW), 2026-2036 (US$ Mn, AGR (%), CAGR (%))
Table 70 Middle East & Africa Small Drones Market by Application, 2026-2036 (US$ Mn, AGR (%), CAGR (%))
Table 71 Middle East & Africa Small Drones Market by Payload Type, 2026-2036 (US$ Mn, AGR (%), CAGR (%))
Table 72 GCC Small Drones Market by Value, 2026-2036 (US$ Mn, AGR (%), CAGR (%))
Table 73 Israel Small Drones Market by Value, 2026-2036 (US$ Mn, AGR (%), CAGR (%))
Table 74 Rest of Middle East & Africa Small Drones Market by Value, 2026-2036 (US$ Mn, AGR (%), CAGR (%))
Table 75 Latin America Small Drones Market by Country, 2026-2036 (US$ Mn, AGR (%), CAGR (%))
Table 76 Latin America Small Drones Market by Propulsion, 2026-2036 (US$ Mn, AGR (%), CAGR (%))
Table 77 Latin America Small Drones Market by Platform, 2026-2036 (US$ Mn, AGR (%), CAGR (%))
Table 78 Latin America Small Drones Market by Maximum Take-off Weight (MTOW), 2026-2036 (US$ Mn, AGR (%), CAGR (%))
Table 79 Latin America Small Drones Market by Application, 2026-2036 (US$ Mn, AGR (%), CAGR (%))
Table 80 Latin America Small Drones Market by Payload Type, 2026-2036 (US$ Mn, AGR (%), CAGR (%))
Table 81 Brazil Small Drones Market by Value, 2026-2036 (US$ Mn, AGR (%), CAGR (%))
Table 82 Mexico Small Drones Market by Value, 2026-2036 (US$ Mn, AGR (%), CAGR (%))
Table 83 Rest of Latin America Small Drones Market by Value, 2026-2036 (US$ Mn, AGR (%), CAGR (%))
Table 84 Strategic Outlook
Table 85 DJI (Da-Jiang Innovations): Key Details, (CEO, HQ, Revenue, Founded, No. of Employees, Company Type, Website, Business Segment)
Table 86 DJI (Da-Jiang Innovations): Product Benchmarking
Table 87 DJI (Da-Jiang Innovations): Strategic Outlook
Table 88 AeroVironment: Key Details, (CEO, HQ, Revenue, Founded, No. of Employees, Company Type, Website, Business Segment)
Table 89 AeroVironment: Product Benchmarking
Table 90 AeroVironment: Strategic Outlook
Table 91 Skydio: Key Details, (CEO, HQ, Revenue, Founded, No. of Employees, Company Type, Website, Business Segment)
Table 92 Skydio: Product Benchmarking
Table 93 Skydio: Strategic Outlook
Table 94 Parrot: Key Details, (CEO, HQ, Revenue, Founded, No. of Employees, Company Type, Website, Business Segment)
Table 95 Parrot: Product Benchmarking
Table 96 Parrot: Strategic Outlook
Table 97 Autel Robotics: Key Details, (CEO, HQ, Revenue, Founded, No. of Employees, Company Type, Website, Business Segment)
Table 98 Autel Robotics: Product Benchmarking
Table 99 Autel Robotics: Strategic Outlook
Table 100 Teledyne FLIR: Key Details, (CEO, HQ, Revenue, Founded, No. of Employees, Company Type, Website, Business Segment)
Table 101 Teledyne FLIR: Product Benchmarking
Table 102 Teledyne FLIR: Strategic Outlook
Table 103 Elbit Systems: Key Details, (CEO, HQ, Revenue, Founded, No. of Employees, Company Type, Website, Business Segment)
Table 104 Elbit Systems: Product Benchmarking
Table 105 Elbit Systems: Strategic Outlook
Table 106 Israel Aerospace Industries: Key Details, (CEO, HQ, Revenue, Founded, No. of Employees, Company Type, Website, Business Segment)
Table 107 Israel Aerospace Industries: Product Benchmarking
Table 108 Israel Aerospace Industries: Strategic Outlook
Table 109 Northrop Grumman: Key Details, (CEO, HQ, Revenue, Founded, No. of Employees, Company Type, Website, Business Segment)
Table 110 Northrop Grumman: Product Benchmarking
Table 111 Northrop Grumman: Strategic Outlook
Table 112 Lockheed Martin: Key Details, (CEO, HQ, Revenue, Founded, No. of Employees, Company Type, Website, Business Segment)
Table 113 Lockheed Martin: Product Benchmarking
Table 114 Lockheed Martin: Strategic Outlook
Table 115 BAE Systems plc: Key Details, (CEO, HQ, Revenue, Founded, No. of Employees, Company Type, Website, Business Segment)
Table 116 BAE Systems plc: Product Benchmarking
Table 117 BAE Systems plc: Strategic Outlook
Table 118 Saab AB: Key Details, (CEO, HQ, Revenue, Founded, No. of Employees, Company Type, Website, Business Segment)
Table 119 Saab AB: Product Benchmarking
Table 120 Saab AB: Strategic Outlook
Table 121 Rheinmetall: Key Details, (CEO, HQ, Revenue, Founded, No. of Employees, Company Type, Website, Business Segment)
Table 122 Rheinmetall: Product Benchmarking
Table 123 Rheinmetall: Strategic Outlook
Table 124 Thales Group: Key Details, (CEO, HQ, Revenue, Founded, No. of Employees, Company Type, Website, Business Segment)
Table 125 Thales Group: Product Benchmarking
Table 126 Thales Group: Strategic Outlook
Table 127 Quantum-Systems: Key Details, (CEO, HQ, Revenue, Founded, No. of Employees, Company Type, Website, Business Segment)
Table 128 Quantum-Systems: Product Benchmarking
Table 129 Quantum-Systems: Strategic Outlook
Table 130 Uvision Air Ltd.: Key Details, (CEO, HQ, Revenue, Founded, No. of Employees, Company Type, Website, Business Segment)
Table 131 Uvision Air Ltd.: Product Benchmarking
Table 132 Uvision Air Ltd.: Strategic Outlook
Table 133 UVify: Key Details, (CEO, HQ, Revenue, Founded, No. of Employees, Company Type, Website, Business Segment)
Table 134 UVify Factories (POF): Product Benchmarking
Table 135 UVify: Strategic Outlook
Table 136 Delair Key Details, (CEO, HQ, Revenue, Founded, No. of Employees, Company Type, Website, Business Segment)
Table 137 Delair: Product Benchmarking
Table 138 Delair: Strategic Outlook
Table 139 ideaForge: Key Details, (CEO, HQ, Revenue, Founded, No. of Employees, Company Type, Website, Business Segment)
Table 140 IdeaForge: Product Benchmarking
Table 141 IdeaForge: Strategic Outlook
Table 142 Asteria Aerospace: Key Details, (CEO, HQ, Revenue, Founded, No. of Employees, Company Type, Website, Business Segment)
Table 143 Asteria Aerospace: Product Benchmarking
Table 144 Asteria Aerospace: Strategic Outlook
Table 145 Edge Autonomy: Key Details, (CEO, HQ, Revenue, Founded, No. of Employees, Company Type, Website, Business Segment)
Table 146 Edge Autonomy Factories (POF): Product Benchmarking
Table 147 Edge Autonomy: Strategic Outlook
Table 148 EHang Key Details, (CEO, HQ, Revenue, Founded, No. of Employees, Company Type, Website, Business Segment)
Table 149 EHang: Product Benchmarking
Table 150 EHang: Strategic Outlook
Table 151 Yuneec: Key Details, (CEO, HQ, Revenue, Founded, No. of Employees, Company Type, Website, Business Segment)
Table 152 Yuneec: Product Benchmarking
Table 153 Yuneec: Strategic Outlook
Table 154 Wingtra: Key Details, (CEO, HQ, Revenue, Founded, No. of Employees, Company Type, Website, Business Segment)
Table 155 Wingtra: Product Benchmarking
Table 156 Wingtra: Strategic Outlook
Table 157 General Atomics Aeronautical Systems: Key Details, (CEO, HQ, Revenue, Founded, No. of Employees, Company Type, Website, Business Segment)
Table 158 General Atomics Aeronautical Systems: Product Benchmarking
Table 159 General Atomics Aeronautical Systems: Strategic Outlook
List of Figures
Figure 1 Small Drones Market Segmentation
Figure 2 Small Drones Market by Propulsion: Market Attractiveness Index
Figure 3 Small Drones Market by Platform: Market Attractiveness Index
Figure 4 Small Drones Market by Maximum Take-off Weight (MTOW): Market Attractiveness Index
Figure 5 Small Drones Market by Application: Market Attractiveness Index
Figure 6 Small Drones Market by Payload Type: Market Attractiveness Index
Figure 7 Small Drones Market Attractiveness Index by Region
Figure 8 Small Drones Market: Market Dynamics
Figure 9 Small Drones Market: Impact Analysis
Figure 10 Global Small Drones Market by Region, 2026-2036 (US$ Mn, AGR (%)), Tariff Impact V-Shaped Recovery Scenario
Figure 11 Global Small Drones Market by Region, 2026-2036 (US$ Mn, AGR (%)), Tariff Impact U-Shaped Recovery Scenario
Figure 12 Global Small Drones Market by Region, 2026-2036 (US$ Mn, AGR (%)), Tariff Impact L-Shaped Recovery Scenario
Figure 13 Small Drones Market: Porter’s Five Forces Analysis
Figure 14 Small Drones Market: PESTLE Analysis
Figure 15 Small Drones Market by Propulsion: Market Attractiveness Index
Figure 16 Global Small Drones Market by Propulsion, 2026-2036 (US$ Mn, AGR (%))
Figure 17 Small Drones Market Share Forecast by Propulsion, 2026, 2031, 2036 (%)
Figure 18 Electric Propulsion Market by Region, 2026-2036 (US$ Mn, AGR (%))
Figure 19 Electric Propulsion Segment Market Share Forecast by Region, 2026 & 2036 (%)
Figure 20 Hybrid/ Gasoline Propulsion Market by Region, 2026-2036 (US$ Mn, AGR (%))
Figure 21 Hybrid/ Gasoline Propulsion Segment Market Share Forecast by Region, 2026 & 2036 (%)
Figure 22 Small Drones Market by Platform: Market Attractiveness Index
Figure 23 Global Small Drones Market by Platform, 2026-2036 (US$ Mn, AGR (%))
Figure 24 Small Drones Market Share Forecast by Platform, 2026, 2031, 2036 (%)
Figure 25 Rotary-Wing (Multirotor) Market by Region, 2026-2036 (US$ Mn, AGR (%))
Figure 26 Rotary-Wing (Multirotor) Segment Market Share Forecast by Region, 2026 & 2036 (%)
Figure 27 Fixed-Wing Market by Region, 2026-2036 (US$ Mn, AGR (%))
Figure 28 Fixed-Wing Segment Market Share Forecast by Region, 2026 & 2036 (%)
Figure 29 Hybrid VTOL Market by Region, 2026-2036 (US$ Mn, AGR (%))
Figure 30 Hybrid VTOL Segment Market Share Forecast by Region, 2026 & 2036 (%)
Figure 31 Small Drones Market by Maximum Take-off Weight (MTOW): Market Attractiveness Index
Figure 32 Global Small Drones Market by Maximum Take-off Weight (MTOW), 2026-2036 (US$ Mn, AGR (%))
Figure 33 Small Drones Market Share Forecast by Maximum Take-off Weight (MTOW), 2026, 2031, 2036 (%)
Figure 34 <250 g Market by Region, 2026-2036 (US$ Mn, AGR (%))
Figure 35 <250 g Segment Market Share Forecast by Region, 2026 & 2036 (%)
Figure 36 250 g–2 kg Market by Region, 2026-2036 (US$ Mn, AGR (%))
Figure 37 250 g–2 kg Segment Market Share Forecast by Region, 2026 & 2036 (%)
Figure 38 2–10 kg Market by Region, 2026-2036 (US$ Mn, AGR (%))
Figure 39 2–10 kg Segment Market Share Forecast by Region, 2026 & 2036 (%)
Figure 40 10–25 kg Market by Region, 2026-2036 (US$ Mn, AGR (%))
Figure 41 10–25 kg Segment Market Share Forecast by Region, 2026 & 2036 (%)
Figure 42 Small Drones Market by Application: Market Attractiveness Index
Figure 43 Global Small Drones Market by Application, 2026-2036 (US$ Mn, AGR (%))
Figure 44 Small Drones Market Share Forecast by Application, 2026, 2031, 2036 (%)
Figure 45 Security & Surveillance (ISR) Market by Region, 2026-2036 (US$ Mn, AGR (%))
Figure 46 Security & Surveillance (ISR) Segment Market Share Forecast by Region, 2026 & 2036 (%)
Figure 47 Aerial Imaging & Surveying Market by Region, 2026-2036 (US$ Mn, AGR (%))
Figure 48 Aerial Imaging & Surveying Segment Market Share Forecast by Region, 2026 & 2036 (%)
Figure 49 Inspection & Monitoring Market by Region, 2026-2036 (US$ Mn, AGR (%))
Figure 50 Inspection & Monitoring Segment Market Share Forecast by Region, 2026 & 2036 (%)
Figure 51 Agriculture Market by Region, 2026-2036 (US$ Mn, AGR (%))
Figure 52 Agriculture Segment Market Share Forecast by Region, 2026 & 2036 (%)
Figure 53 Other Applications Market by Region, 2026-2036 (US$ Mn, AGR (%))
Figure 54 Other Applications Segment Market Share Forecast by Region, 2026 & 2036 (%)
Figure 55 Small Drones Market by Payload Type: Market Attractiveness Index
Figure 56 Global Small Drones Market by Payload Type, 2026-2036 (US$ Mn, AGR (%))
Figure 57 Small Drones Market Share Forecast by Payload Type, 2026, 2031, 2036 (%)
Figure 58 Optical Payloads Market by Region, 2026-2036 (US$ Mn, AGR (%))
Figure 59 Optical Payloads Segment Market Share Forecast by Region, 2026 & 2036 (%)
Figure 60 LiDAR Payloads Market by Region, 2026-2036 (US$ Mn, AGR (%))
Figure 61 LiDAR Payloads Segment Market Share Forecast by Region, 2026 & 2036 (%)
Figure 62 SIGINT / EW Payloads Market by Region, 2026-2036 (US$ Mn, AGR (%))
Figure 63 SIGINT / EW Payloads Segment Market Share Forecast by Region, 2026 & 2036 (%)
Figure 64 Thermal Imaging Payloads Market by Region, 2026-2036 (US$ Mn, AGR (%))
Figure 65 Thermal Imaging Payloads Segment Market Share Forecast by Region, 2026 & 2036 (%)
Figure 66 Multispectral Payloads Market by Region, 2026-2036 (US$ Mn, AGR (%))
Figure 67 Multispectral Payloads Segment Market Share Forecast by Region, 2026 & 2036 (%)
Figure 68 Hyperspectral Payloads Market by Region, 2026-2036 (US$ Mn, AGR (%))
Figure 69 Hyperspectral Payloads Segment Market Share Forecast by Region, 2026 & 2036 (%)
Figure 70 Small Drones Market Forecast by Region 2026 and 2036 (Revenue, CAGR%)
Figure 71 Small Drones Market Share Forecast by Region 2026, 2031, 2036 (%)
Figure 72 Global Small Drones Market by Region, 2026-2036 (US$ Mn, AGR (%))
Figure 73 North America Small Drones Market Attractiveness Index
Figure 74 North America Small Drones Market by Region, 2026, 2031 & 2036 (US$ Million)
Figure 75 North America Small Drones Market by Country, 2026-2036 (US$ Mn, AGR (%))
Figure 76 North America Small Drones Market Share Forecast by Country, 2026 & 2036 (%)
Figure 77 North America Small Drones Market by Propulsion, 2026-2036 (US$ Mn, AGR (%))
Figure 78 North America Small Drones Market Share Forecast by Propulsion, 2026 & 2036 (%)
Figure 79 North America Small Drones Market by Platform, 2026-2036 (US$ Mn, AGR (%))
Figure 80 North America Small Drones Market Share Forecast by Platform, 2026 & 2036 (%)
Figure 81 North America Small Drones Market by Maximum Take-off Weight (MTOW), 2026-2036 (US$ Mn, AGR (%))
Figure 82 North America Small Drones Market Share Forecast by Maximum Take-off Weight (MTOW), 2026 & 2036 (%)
Figure 83 North America Small Drones Market by Application, 2026-2036 (US$ Mn, AGR (%))
Figure 84 North America Small Drones Market Share Forecast by Application, 2026 & 2036 (%)
Figure 85 North America Small Drones Market by Payload Type, 2026-2036 (US$ Mn, AGR (%))
Figure 86 North America Small Drones Market Share Forecast by Payload Type, 2026 & 2036 (%)
Figure 87 US Small Drones Market by Value, 2026-2036 (US$ Mn, AGR (%))
Figure 88 Canada Small Drones Market by Value, 2026-2036 (US$ Mn, AGR (%))
Figure 89 Europe Small Drones Market Attractiveness Index
Figure 90 Europe Small Drones Market by Region, 2026, 2031 & 2036 (US$ Million)
Figure 91 Europe Small Drones Market by Country, 2026-2036 (US$ Mn, AGR (%))
Figure 92 Europe Small Drones Market Share Forecast by Country, 2026 & 2036 (%)
Figure 93 Europe Small Drones Market by Propulsion, 2026-2036 (US$ Mn, AGR (%))
Figure 94 Europe Small Drones Market Share Forecast by Propulsion, 2026 & 2036 (%)
Figure 95 Europe Small Drones Market by Platform, 2026-2036 (US$ Mn, AGR (%))
Figure 96 Europe Small Drones Market Share Forecast by Platform, 2026 & 2036 (%)
Figure 97 Europe Small Drones Market by Maximum Take-off Weight (MTOW), 2026-2036 (US$ Mn, AGR (%))
Figure 98 Europe Small Drones Market Share Forecast by Maximum Take-off Weight (MTOW), 2026 & 2036 (%)
Figure 99 Europe Small Drones Market by Application, 2026-2036 (US$ Mn, AGR (%))
Figure 100 Europe Small Drones Market Share Forecast by Application, 2026 & 2036 (%)
Figure 101 Europe Small Drones Market by Payload Type, 2026-2036 (US$ Mn, AGR (%))
Figure 102 Europe Small Drones Market Share Forecast by Payload Type, 2026 & 2036 (%)
Figure 103 Germany Small Drones Market by Value, 2026-2036 (US$ Mn, AGR (%))
Figure 104 UK Small Drones Market by Value, 2026-2036 (US$ Mn, AGR (%))
Figure 105 France Small Drones Market by Value, 2026-2036 (US$ Mn, AGR (%))
Figure 106 Italy Small Drones Market by Value, 2026-2036 (US$ Mn, AGR (%))
Figure 107 Spain Small Drones Market by Value, 2026-2036 (US$ Mn, AGR (%))
Figure 108 Rest of Europe Small Drones Market by Value, 2026-2036 (US$ Mn, AGR (%))
Figure 109 Asia-Pacific Small Drones Market Attractiveness Index
Figure 110 Asia-Pacific Small Drones Market by Region, 2026, 2031 & 2036 (US$ Million)
Figure 111 Asia-Pacific Small Drones Market by Country, 2026-2036 (US$ Mn, AGR (%))
Figure 112 Asia-Pacific Small Drones Market Share Forecast by Country, 2026 & 2036 (%)
Figure 113 Asia-Pacific Small Drones Market by Propulsion, 2026-2036 (US$ Mn, AGR (%))
Figure 114 Asia-Pacific Small Drones Market Share Forecast by Propulsion, 2026 & 2036 (%)
Figure 115 Asia-Pacific Small Drones Market by Platform, 2026-2036 (US$ Mn, AGR (%))
Figure 116 Asia-Pacific Small Drones Market Share Forecast by Platform, 2026 & 2036 (%)
Figure 117 Asia-Pacific Small Drones Market by Maximum Take-off Weight (MTOW), 2026-2036 (US$ Mn, AGR (%))
Figure 118 Asia-Pacific Small Drones Market Share Forecast by Maximum Take-off Weight (MTOW), 2026 & 2036 (%)
Figure 119 Asia-Pacific Small Drones Market by Application, 2026-2036 (US$ Mn, AGR (%))
Figure 120 Asia-Pacific Small Drones Market Share Forecast by Application, 2026 & 2036 (%)
Figure 121 Asia-Pacific Small Drones Market by Payload Type, 2026-2036 (US$ Mn, AGR (%))
Figure 122 Asia-Pacific Small Drones Market Share Forecast by Payload Type, 2026 & 2036 (%)
Figure 123 China Small Drones Market by Value, 2026-2036 (US$ Mn, AGR (%))
Figure 124 India Small Drones Market by Value, 2026-2036 (US$ Mn, AGR (%))
Figure 125 Japan Small Drones Market by Value, 2026-2036 (US$ Mn, AGR (%))
Figure 126 South Korea Small Drones Market by Value, 2026-2036 (US$ Mn, AGR (%))
Figure 127 Australia Small Drones Market by Value, 2026-2036 (US$ Mn, AGR (%))
Figure 128 Rest of Asia-Pacific Small Drones Market by Value, 2026-2036 (US$ Mn, AGR (%))
Figure 129 Middle East and Africa Small Drones Market Attractiveness Index
Figure 130 Middle East and Africa Small Drones Market by Region, 2026, 2031 & 2036 (US$ Million)
Figure 131 Middle East & Africa Small Drones Market by Country, 2026-2036 (US$ Mn, AGR (%))
Figure 132 Middle East and Africa Small Drones Market Share Forecast by Country, 2026 & 2036 (%)
Figure 133 Middle East & Africa Small Drones Market by Propulsion, 2026-2036 (US$ Mn, AGR (%))
Figure 134 Middle East and Africa Small Drones Market Share Forecast by Propulsion, 2026 & 2036 (%)
Figure 135 Middle East & Africa Small Drones Market by Platform, 2026-2036 (US$ Mn, AGR (%))
Figure 136 Middle East and Africa Small Drones Market Share Forecast by Platform, 2026 & 2036 (%)
Figure 137 Middle East & Africa Small Drones Market by Maximum Take-off Weight (MTOW), 2026-2036 (US$ Mn, AGR (%))
Figure 138 Middle East and Africa Small Drones Market Share Forecast by Maximum Take-off Weight (MTOW), 2026 & 2036 (%)
Figure 139 Middle East & Africa Small Drones Market by Application, 2026-2036 (US$ Mn, AGR (%))
Figure 140 Middle East and Africa Small Drones Market Share Forecast by Application, 2026 & 2036 (%)
Figure 141 Middle East & Africa Small Drones Market by Payload Type, 2026-2036 (US$ Mn, AGR (%))
Figure 142 Middle East and Africa Small Drones Market Share Forecast by Payload Type, 2026 & 2036 (%)
Figure 143 GCC Small Drones Market by Value, 2026-2036 (US$ Mn, AGR (%))
Figure 144 Israel Small Drones Market by Value, 2026-2036 (US$ Mn, AGR (%))
Figure 145 Rest of Middle East & Africa Small Drones Market by Value, 2026-2036 (US$ Mn, AGR (%))
Figure 146 Latin America Small Drones Market Attractiveness Index
Figure 147 Latin America Small Drones Market by Region, 2026, 2031 & 2036 (US$ Million)
Figure 148 Latin America Small Drones Market by Country, 2026-2036 (US$ Mn, AGR (%))
Figure 149 Latin America Small Drones Market Share Forecast by Country, 2026 & 2036 (%)
Figure 150 Latin America Small Drones Market by Propulsion, 2026-2036 (US$ Mn, AGR (%))
Figure 151 Latin America Small Drones Market Share Forecast by Propulsion, 2026 & 2036 (%)
Figure 152 Latin America Small Drones Market by Platform, 2026-2036 (US$ Mn, AGR (%))
Figure 153 Latin America Small Drones Market Share Forecast by Platform, 2026 & 2036 (%)
Figure 154 Latin America Small Drones Market by Maximum Take-off Weight (MTOW), 2026-2036 (US$ Mn, AGR (%))
Figure 155 Latin America Small Drones Market Share Forecast by Maximum Take-off Weight (MTOW), 2026 & 2036 (%)
Figure 156 Latin America Small Drones Market by Application, 2026-2036 (US$ Mn, AGR (%))
Figure 157 Latin America Small Drones Market Share Forecast by Application, 2026 & 2036 (%)
Figure 158 Latin America Small Drones Market by Payload Type, 2026-2036 (US$ Mn, AGR (%))
Figure 159 Latin America Small Drones Market Share Forecast by Payload Type, 2026 & 2036 (%)
Figure 160 Brazil Small Drones Market by Value, 2026-2036 (US$ Mn, AGR (%))
Figure 161 Mexico Small Drones Market by Value, 2026-2036 (US$ Mn, AGR (%))
Figure 162 Rest of Latin America Small Drones Market by Value, 2026-2036 (US$ Mn, AGR (%))
Figure 163 Small Drones Market: Company Share (%), 2024
Figure 164 DJI (Da-Jing Innovations): SWOT Analysis
Figure 165 AeroVironment: Net Revenue, 2020-2024 (US$ Million, AGR%)
Figure 166 AeroVironment: R&D, 2020-2024 (US$ Million, AGR%)
Figure 167 AeroVironment: Regional Market Shares (%), 2024
Figure 168 AeroVironment: Business Segment Market Shares (%), 2024
Figure 169 AeroVironment: SWOT Analysis
Figure 170 Skydio: SWOT Analysis
Figure 171 Parrot: Net Revenue, 2020-2024 (US$ Million, AGR%)
Figure 172 Parrot: Business Segment Market Shares (%), 2024
Figure 173 Parrot: SWOT Analysis
Figure 174 Autel Robotics: SWOT Analysis
Figure 175 Teledyne FLIR: Net Revenue, 2020-2024 (US$ Million, AGR%)
Figure 176 Teledyne FLIR: R&D, 2020-2024 (US$ Million, AGR%)
Figure 177 Teledyne FLIR: Regional Market Shares (%), 2024
Figure 178 Teledyne FLIR: Business Segment Market Shares (%), 2024
Figure 179 Teledyne FLIR: SWOT Analysis
Figure 180 Elbit Systems: Net Revenue, 2020-2024 (US$ Million, AGR%)
Figure 181 Elbit Systems: R&D, 2020-2024 (US$ Million, AGR%)
Figure 182 Elbit Systems: Regional Market Shares (%), 2024
Figure 183 Elbit Systems: Business Segment Market Shares (%), 2024
Figure 184 Elbit Systems: SWOT Analysis
Figure 185 Israel Aerospace Industries: Net Revenue, 2020-2024 (US$ Million, AGR%)
Figure 186 Israel Aerospace Industries: R&D, 2020-2024 (US$ Million, AGR%)
Figure 187 Israel Aerospace Industries: Regional Market Shares (%), 2024
Figure 188 Israel Aerospace Industries: Business Segment Market Shares (%), 2024
Figure 189 Israel Aerospace Industries: SWOT Analysis
Figure 190 Northrop Grumman: Net Revenue, 2020-2024 (US$ Million, AGR%)
Figure 191 Northrop Grumman: R&D, 2020-2024 (US$ Million, AGR%)
Figure 192 Northrop Grumman: Regional Market Shares (%), 2024
Figure 193 Northrop Grumman: Business Segment Market Shares (%), 2024
Figure 194 Northrop Grumman: SWOT Analysis
Figure 195 Lockheed Martin: Net Revenue, 2020-2024 (US$ Million, AGR%)
Figure 196 Lockheed Martin: R&D, 2020-2024 (US$ Million, AGR%)
Figure 197 Lockheed Martin: Regional Market Shares (%), 2024
Figure 198 Lockheed Martin: Business Segment Market Shares (%), 2024
Figure 199 Lockheed Martin: SWOT Analysis
Figure 200 BAE Systems plc: Net Revenue, 2020-2024 (US$ Million, AGR%)
Figure 201 BAE Systems plc: R&D, 2020-2024 (US$ Million, AGR%)
Figure 202 BAE Systems plc: Regional Market Shares (%), 2024
Figure 203 BAE Systems plc: Business Segment Market Shares (%), 2024
Figure 204 BAE Systems plc: SWOT Analysis
Figure 205 Saab AB: Net Revenue, 2020-2024 (US$ Million, AGR%)
Figure 206 Saab AB: R&D, 2020-2024 (US$ Million, AGR%)
Figure 207 Saab AB: Regional Market Shares (%), 2024
Figure 208 Saab AB: Business Segment Market Shares (%), 2024
Figure 209 Saab AB: SWOT Analysis
Figure 210 Rheinmetall: Net Revenue, 2020-2024 (US$ Million, AGR%)
Figure 211 Rheinmetall: R&D, 2020-2024 (US$ Million, AGR%)
Figure 212 Rheinmetall: Regional Market Shares (%), 2024
Figure 213 Rheinmetall: Business Segment Market Shares (%), 2024
Figure 214 Rheinmetall: SWOT Analysis
Figure 215 Thales Group: Net Revenue, 2020-2024 (US$ Million, AGR%)
Figure 216 Thales Group: R&D, 2020-2024 (US$ Million, AGR%)
Figure 217 Thales Group: Regional Market Shares (%), 2024
Figure 218 Thales Group: Business Segment Market Shares (%), 2024
Figure 219 Thales Group: SWOT Analysis
Figure 220 Quantum-Systems: SWOT Analysis
Figure 221 Uvision Air Ltd.: SWOT Analysis
Figure 222 UVify: SWOT Analysis
Figure 223 Delair: SWOT Analysis
Figure 224 IdeaForge: Net Revenue, 2020-2024 (US$ Million, AGR%)
Figure 225 IdeaForge: Business Segment Market Shares (%), 2024
Figure 226 ideaForge: SWOT Analysis
Figure 227 Asteria Aerospace: SWOT Analysis
Figure 228 Edge Autonomy: SWOT Analysis
Figure 229 EHang: Net Revenue, 2020-2024 (US$ Million, AGR%)
Figure 230 EHang: SWOT Analysis
Figure 231 Yuneec: SWOT Analysis
Figure 232 Wingtra: SWOT Analysis
Figure 233 General Atomics Aeronautical Systems: SWOT Analysis
ページTOPに戻る
本レポートと同じKEY WORD(drones)の最新刊レポート
関連レポート(キーワード「ドローン」)
よくあるご質問
Visiongain社はどのような調査会社ですか?
英国の調査会社ヴィジョンゲイン社(Visiongain)は、通信とエネルギーのほか、自動車や化学・医薬品、金属など、広範な市場を対象に調査を行っています。自動車市場については、市場全般に関する調査のほ... もっと見る
調査レポートの納品までの日数はどの程度ですか?
在庫のあるものは速納となりますが、平均的には 3-4日と見て下さい。
但し、一部の調査レポートでは、発注を受けた段階で内容更新をして納品をする場合もあります。
発注をする前のお問合せをお願いします。
注文の手続きはどのようになっていますか?
1)お客様からの御問い合わせをいただきます。
2)見積書やサンプルの提示をいたします。
3)お客様指定、もしくは弊社の発注書をメール添付にて発送してください。
4)データリソース社からレポート発行元の調査会社へ納品手配します。
5) 調査会社からお客様へ納品されます。最近は、pdfにてのメール納品が大半です。
お支払方法の方法はどのようになっていますか?
納品と同時にデータリソース社よりお客様へ請求書(必要に応じて納品書も)を発送いたします。
お客様よりデータリソース社へ(通常は円払い)の御振り込みをお願いします。
請求書は、納品日の日付で発行しますので、翌月最終営業日までの当社指定口座への振込みをお願いします。振込み手数料は御社負担にてお願いします。
お客様の御支払い条件が60日以上の場合は御相談ください。
尚、初めてのお取引先や個人の場合、前払いをお願いすることもあります。ご了承のほど、お願いします。
データリソース社はどのような会社ですか?
当社は、世界各国の主要調査会社・レポート出版社と提携し、世界各国の市場調査レポートや技術動向レポートなどを日本国内の企業・公官庁及び教育研究機関に提供しております。
世界各国の「市場・技術・法規制などの」実情を調査・収集される時には、データリソース社にご相談ください。
お客様の御要望にあったデータや情報を抽出する為のレポート紹介や調査のアドバイスも致します。
|
|


