細胞・遺伝子治療市場レポート:2026-2036
Cell & Gene Therapy Market Report 2026-2036
説明
世界の細胞・遺伝子治療市場は、先進的な治療法が商業利用へとさらに進展するにつれ、2026年の257億8,000万米ドルから2036年までに1,268億6,000万米ドルへと、年平均成長率(CAGR)17.3%で拡大... もっと見る
※上記価格は部署ライセンス(Departmental licence)価格です。
その他の価格についてはデータリソースまでお問合せください。
日本語のページは自動翻訳を利用し作成しています。
実際のレポートは英文のみでご納品いたします。

|
サマリー
説明
世界の細胞・遺伝子治療市場は、先進的な治療法が商業利用へとさらに進展するにつれ、2026年の257億8,000万米ドルから2036年までに1,268億6,000万米ドルへと、年平均成長率(CAGR)17.3%で拡大すると予測されており、力強い成長が見込まれている。
この成長は、遺伝性疾患や慢性疾患の有病率の上昇、ゲノム科学の継続的な進歩、そしてがんや希少疾患の分野における根治的治療法の臨床導入拡大によって牽引されています。
技術革新が市場の拡大を牽引している
遺伝子編集、ウイルスベクターの開発、および細胞工学の進歩により、細胞・遺伝子治療市場は大きく様変わりしつつある。CRISPRを用いた編集技術や次世代CAR-T療法などの技術により、精度、スケーラビリティ、そして臨床成績が向上している。
同時に、製造プロセスの改善や自動化により、生産の複雑さが軽減され、より広範な商業化が可能になっています。また、ゲノムデータと個別化医療のアプローチを統合することで、治療可能な疾患の範囲も拡大しています。
遺伝性疾患の発生率上昇が市場の需要を牽引している
遺伝性および先天性疾患による世界的な負担の増大は、細胞・遺伝子治療への需要を支え続けています。これらの治療法は、症状の管理にとどまらず、疾患の根本的なメカニズムに直接働きかけることが可能であり、現代医学における画期的なアプローチとして位置づけられています。
診断法とスクリーニング技術の進歩により、遺伝性疾患の早期発見が可能となり、患者の層別化が促進され、臨床開発パイプラインが加速しています。
高額な治療費が市場の普及を妨げている
高額な初期費用が依然として大きな障壁となっている。多くの治療法は患者1人あたり200万米ドルを超えるため、医療制度や保険者にとって費用負担の課題となっている。
償還の枠組みは依然として変化の途上にあり、成果連動型や分割払いモデルが注目を集めているものの、まだ広く普及しているわけではない。償還決定の遅れや治療インフラの不足が、患者のアクセスや市場への浸透に引き続き影響を及ぼしている。
貿易、政策、およびサプライチェーンの動向
細胞・遺伝子治療市場は、特殊な材料、試薬、製造装置の供給において、複雑なグローバルサプライチェーンに依存している。
米国の関税措置により、輸入原材料のコストが上昇し、特に中小のバイオテクノロジー企業においてサプライチェーンの不確実性が高まる可能性がある。こうした圧力は、開発スケジュール、製造能力、そして事業全体の拡張性に影響を及ぼす恐れがある。
ビジネスへの影響
-
コストと価格圧力:高額な治療費と原材料価格の高騰が市場参入の行方を左右している
-
サプライチェーンの変容:企業は、強靭で地域に根差した製造体制への投資を進めている
-
規制の影響:承認プロセスと償還枠組みは依然として極めて重要である
-
競合優位性:拡張性の高いプラットフォームと充実したパイプラインを持つ企業が主導権を握っている
企業情報
この市場は競争が激しく、大手製薬会社と専門性の高いバイオテクノロジー企業が混在し、イノベーションを推進している。
主要企業は、自社の地位を強化するため、パイプラインの拡大、戦略的提携、および製造能力の強化に注力している。
競争は、ますます次のような要素によって特徴づけられるようになっている:
-
臨床パイプラインの強み
-
技術プラットフォームとイノベーション
-
製造の拡張性
-
規制対応および事業運営
本報告書では、競争環境がどのように変化しているか、また将来どのような機会が生まれるかを分析しています。
主な質問への回答
-
細胞・遺伝子治療市場はどのように変化しているのでしょうか?
-
成長を左右する主な要因と制約要因は何でしょうか?
-
どのセグメントや地域が最も多くの収益を生み出すでしょうか?
-
償還や価格設定のモデルは今後どのように変化していくのでしょうか?
-
主要企業はどこか、またその見通しはどうか?
レポートの範囲とデータ対象範囲
-
世界の細胞・遺伝子治療市場分析
-
2036年までの売上高予測
-
治療法、適応症、ベクターの種類、およびエンドユーザーを横断したセグメントレベルのモデリング
-
地域別および全国市場の予測
-
主要企業に関する競合情報
セグメンテーションの枠組み
治療法別
-
細胞療法
- 幹細胞療法
- CAR-T細胞療法
- TCR-T細胞療法
- その他
-
遺伝子治療
- 遺伝子増強療法
- 遺伝子抑制療法
- 遺伝子編集
- その他
適応別
-
腫瘍学
-
遺伝性疾患
-
心血管疾患
-
神経疾患
-
感染症
-
眼科疾患
-
その他
ベクタータイプ別
-
ウイルスベクター
-
レトロウイルス
-
レンチウイルス
-
アデノウイルス
-
AAV
-
その他
-
非ウイルスベクター
エンドユーザー別
対象地域
北米
欧州
-
ドイツ
-
イギリス
-
フランス
-
イタリア
-
スペイン
-
ロシア
-
その他の欧州地域
アジア太平洋
-
日本
-
中国
-
インド
-
オーストラリア
-
韓国
-
シンガポール
-
その他のアジア太平洋地域
ラテンアメリカ
-
ブラジル
-
メキシコ
-
アルゼンチン
-
その他のラテンアメリカ地域
中東・アフリカ
-
おはようございます
-
南アフリカ
-
その他の中東・アフリカ地域
企業情報 対象範囲
本レポートには、以下のような主要企業の詳細なプロファイルが掲載されています:
-
Adaptimmune
-
ALLOGENE THERAPEUTICS
-
Atara Biotherapeutics, Inc.
-
Beam Therapeutics
-
BioMarin
-
Bristol-Myers Squibb Company
-
Catalent, Inc
-
CRISPR Therapeutics
-
Genetix Biotherapeutics Inc.
-
GenScript
-
Gilead Sciences, Inc.
-
Intellia Therapeutics, Inc.
-
Johnson & Johnson
-
Lonza
-
MeiraGTx Limited
-
Novartis AG
-
Sarepta Therapeutics, Inc.
-
Ultragenyx Pharmaceutical Inc.
-
Vertex Pharmaceuticals Incorporated
各プロフィールには以下の内容が含まれます:
オーダーメイドのインテリジェンスとカスタマイズ
Visiongainは、カスタム予測、競合他社とのベンチマーク、規制分析など、特定のビジネスニーズに対応したオーダーメイドの情報を提供しています。
この市場情報が重要な理由
-
細胞・遺伝子治療市場は、科学的なブレークスルー、臨床現場での普及拡大、そして償還モデルの進化を背景に、重要な成長段階を迎えつつある。
-
こうした力学を理解している組織は、機会を捉え、リスクを管理し、競争力を強化する上で、より有利な立場に立つことができるでしょう。
ページTOPに戻る
目次
1 レポートの概要
1.1 本調査の目的
1.2 細胞・遺伝子治療市場の概要
1.3 本レポートの内容
1.4 本レポートを読むべき理由
1.5 本分析レポートが回答する主要な質問
1.6 本レポートの対象読者
1.7 調査方法
1.7.1 市場の定義
1.7.2 市場評価および予測手法
1.7.3 データ検証
1.7.3.1 一次調査
1.7.3.2 二次調査
1.8 よくある質問(FAQ)
1.9 関連するVisiongainレポート
1.10 Visiongainについて
2 エグゼクティブ・サマリー
3 市場概要
3.1 主な調査結果
3.2 市場動向
3.3 影響分析
3.3.1 市場を牽引する要因
3.3.1.1 遺伝性疾患の有病率上昇が先進的治療法の採用を促進
3.3.1.2 バイオテクノロジー研究への投資拡大がパイプラインの革新と拡大を牽引
3.3.1.3 承認件数の増加が新規治療法の商業化を加速。
3.3.2 市場の抑制要因
3.3.2.1 治療費の高さが患者のアクセスと市場浸透を制限。
3.3.2.2 複雑な製造プロセスが世界的なサプライチェーンのボトルネックを引き起こしている。
3.3.2.3 厳格な規制枠組みが製品承認と市場参入を遅延させている
3.3.3 市場の機会
3.3.3.1 先進的治療法の統合を世界的に支える医療インフラの拡大
3.3.3.2 個別化医療における急速なイノベーションを促進する新たな連携
3.3.3.3 細胞療法のスケーラブルな生産を可能にする技術的進歩
3.4 米国の関税:世界の細胞・遺伝子治療市場への影響は?
3.4.1 概要
3.4.2 V字型回復シナリオ
3.4.2.1 なぜV字型回復なのか?
3.4.2.2 関税による影響
3.4.2.3 市場の動向と需要の回復
3.4.2.4 政策および資金支援
3.4.2.5 回復までの期間
3.4.3 U字型回復シナリオ
3.4.3.1 なぜU字型回復なのか?
3.4.3.2 関税の影響
3.4.3.3 市場の動向と需要の回復
3.4.3.4 政策および資金支援
3.4.3.5 回復までの期間
3.4.4 L字型回復シナリオ
3.4.4.1 なぜL字型回復なのか?
3.4.4.2 関税の影響
3.4.4.3 市場の動向と需要の回復
3.4.4.4 政策および資金支援
3.4.4.5 回復までの期間
3.4.5 顧客は短期(2026年~2030年)および長期(2031年~2036年)の計画において、どのような戦略的考慮事項を組み込むべきか?
3.4.6 米国と中国の貿易戦争が細胞・遺伝子治療市場に与える影響
3.4.7 最も影響を受ける国々は、これらの政策変更によりどのようなプラスおよびマイナスの影響を受ける可能性があるか?
3.4.8 世界の市場における関税感応度および利益率への圧力分析
3.5 ポーターの5つの力分析
3.5.1 供給者の交渉力
3.5.2 購入者の交渉力
3.5.3 競合他社間の競争
3.5.4 代替品の脅威
3.5.5 新規参入の脅威
3.6 PEST分析
4 細胞・遺伝子治療市場分析:治療法別
4.1 主な調査結果
4.2 治療法別セグメント:市場魅力度指数
4.3 治療法別細胞・遺伝子治療市場規模の推計と予測
4.4 細胞治療
4.4.1 地域別市場規模、2026年~2036年(10億米ドル)
4.4.2 地域別市場シェア、2026年および2036年(%)
4.4.3 幹細胞療法
4.4.3.1 地域別市場規模、2026年~2036年(10億米ドル)
4.4.3.2 地域別市場シェア、2026年および2036年(%)
4.4.4 CAR-T細胞療法
4.4.4.1 地域別市場規模、2026年~2036年(10億米ドル)
4.4.4.2 地域別市場シェア、2026年および2036年(%)
4.4.5 TCR-T細胞療法
4.4.5.1 地域別市場規模、2026年~2036年(10億米ドル)
4.4.5.2 地域別市場シェア、2026年および2036年(%)
4.4.6 その他
4.4.6.1 地域別市場規模、2026年~2036年(10億米ドル)
4.4.6.2 地域別市場シェア、2026年および2036年(%)
4.5 遺伝子治療
4.5.1 地域別市場規模、2026年~2036年(10億米ドル)
4.5.2 地域別市場シェア、2026年および2036年(%)
4.5.3 遺伝子増強療法
4.5.3.1 地域別市場規模、2026年~2036年(10億米ドル)
4.5.3.2 地域別市場シェア、2026年および2036年(%)
4.5.4 遺伝子抑制療法
4.5.4.1 地域別市場規模、2026年~2036年(10億米ドル)
4.5.4.2 地域別市場シェア、2026年および2036年(%)
4.5.5 遺伝子編集
4.5.5.1 地域別市場規模、2026年~2036年(10億米ドル)
4.5.5.2 地域別市場シェア、2026年および2036年(%)
4.5.6 その他
4.5.6.1 地域別市場規模、2026年~2036年(10億米ドル)
4.5.6.2 地域別市場シェア、2026年および2036年(%)
5. 細胞・遺伝子治療市場分析:適応症別
5. 細胞・遺伝子治療市場の適応症別分析
5.1 主な調査結果
5.2 治療タイプ別セグメント:市場魅力度指数
5.3 細胞・遺伝子治療市場の適応症別規模推定と予測
5.4 腫瘍学
5.4.1 地域別市場規模、2026年~2036年(10億米ドル)
5.4.2 地域別市場シェア(2026年および2036年)(%)
5.5 遺伝性疾患
5.5.1 地域別市場規模、2026年~2036年(10億米ドル)
5.5.2 地域別市場シェア(2026年および2036年)(%)
5.6 心血管疾患
5.6.1 地域別市場規模、2026年~2036年(10億米ドル)
5.6.2 地域別市場シェア(2026年および2036年)(%)
5.7 神経疾患疾患
5.7.1 地域別市場規模、2026年~2036年(10億米ドル)
5.7.2 地域別市場シェア、2026年および2036年(%)
5.8 感染症
5.8.1 地域別市場規模、2026年~2036年(10億米ドル)
5.8.2 地域別市場シェア、2026年および2036年(%)
5.9 眼疾患
5.9.1 地域別市場規模、2026年~2036年(10億米ドル)
5.9.2 地域別市場シェア、2026年および2036年(%)
5.10 その他
5.10.1 地域別市場規模、2026年~2036年(10億米ドル)
5.10.2 地域別市場シェア、2026年および2036年(%)
6 細胞・遺伝子治療市場分析:ベクタータイプ別
6.1 主な調査結果
6.2 ベクタータイプセグメント:市場魅力度指数
6.3 ベクタータイプ別細胞・遺伝子治療市場規模の推計および予測
6.4 ウイルスベクター
6.4.1 地域別市場規模、2026年~2036年(10億米ドル)
6.4.2 地域別市場シェア、2026年および2036年(%)
6.4.3 レトロウイルス
6.4.3.1 地域別市場規模、2026年~2036年(10億米ドル)
6.4.3.2 地域別市場シェア、2026年および2036年(%)
6.4.4 レンチウイルス
6.4.4.1 地域別市場規模、2026年~2036年(10億米ドル)
6.4.4.2 地域別市場シェア、2026年および2036年(%)
6.4.5 アデノウイルス
6.4.5.1 地域別市場規模、2026年~2036年(10億米ドル)
6.4.5.2 地域別市場シェア、2026年および2036年(%)
6.4.6 AAV
6.4.6.1 地域別市場規模、2026年~2036年(10億米ドル)
6.4.6.2 地域別市場シェア、2026年および2036年(%)
6.4.7 その他
6.4.7.1 地域別市場規模、2026年~2036年(10億米ドル)
6.4.7.2 地域別市場シェア、2026年および2036年(%)
6.5 非ウイルス性ベクター
6.5.1 地域別市場規模、2026年~2036年(10億米ドル)
6.5.2 地域別市場シェア、2026年および2036年(%)
7 細胞・遺伝子治療市場分析:エンドユーザー別
7.1 主な調査結果
7.2 エンドユーザーセグメント:市場魅力度指数
7.3 エンドユーザー別細胞・遺伝子治療市場規模の推計および予測
7.4 病院
7.4.1 地域別市場規模、2026年~2036年(10億米ドル)
7.4.2 地域別市場シェア、2026年および2036年(%)
7.5 研究機関
7.5.1 地域別市場規模、2026年~2036年(10億米ドル)
7.5.2 地域別市場シェア、2026年および2036年(%)
7.6 製薬会社
7.6.1 地域別市場規模、2026年~2036年(10億米ドル)
7.6.2 地域別市場シェア、2026年および2036年(%)
7.7 その他
7.7.1 地域別市場規模、2026年~2036年(10億米ドル)
7.7.2 地域別市場シェア、2026年および2036年(%)
8 細胞・遺伝子治療市場分析:地域別
8.1 主な調査結果
8.2 地域別市場規模の推計と予測
9 北米の細胞・遺伝子治療市場の分析
9.1 主な調査結果
9.2 北米の細胞・遺伝子治療市場の魅力度指数
9.3 北米の細胞・遺伝子治療市場国別、2026年、2031年、2036年(10億米ドル)
9.4 北米の細胞・遺伝子治療市場の規模推定と予測:国別
9.5 北米の細胞・遺伝子治療市場の規模推定と予測:治療法別
9.6 北米の細胞・遺伝子治療市場の規模推定と予測:適応症別
9.7 北米の細胞・遺伝子治療市場の規模推定と予測:ベクタータイプ別
9.8 北米の細胞・遺伝子治療市場の規模推定と予測:エンドユーザー別
9.9 米国の細胞・遺伝子治療市場の分析
9.10 カナダの細胞・遺伝子治療市場分析
10 欧州の細胞・遺伝子治療市場の分析
10.1 主な調査結果
10.2 欧州の細胞・遺伝子治療市場の魅力度指数
10.3 欧州の細胞・遺伝子治療市場国別、2026年、2031年、2036年(10億米ドル)
10.4 欧州の細胞・遺伝子治療市場規模の推定と予測:国別
10.5 欧州の細胞・遺伝子治療市場規模の推定と予測:治療法別
10.6 欧州の細胞・遺伝子治療市場規模の推定と予測:適応症別
10.7 欧州の細胞・遺伝子治療市場規模の推定と予測:ベクタータイプ別
10.8 欧州の細胞・遺伝子治療市場規模の推定と予測:エンドユーザー別
10.9 ドイツの細胞・遺伝子治療市場分析
10.10 フランスの細胞・遺伝子治療市場分析
10.11 英国の細胞・遺伝子治療市場分析
10.12 イタリアの細胞・遺伝子治療市場分析
10.13 スペインの細胞・遺伝子治療市場分析
10.14 ロシアの細胞・遺伝子治療市場分析
10.15 その他の欧州地域の細胞・遺伝子治療市場分析
11 アジア太平洋地域の細胞・遺伝子治療市場分析
11.1 主な調査結果
11.2 アジア太平洋地域の細胞・遺伝子治療市場の魅力度指数
11.3 アジア太平洋地域の細胞・遺伝子治療市場国別、2026年、2031年、2036年(10億米ドル)
11.4 アジア太平洋地域の細胞・遺伝子治療市場規模推定と予測:国別
11.5 アジア太平洋地域の細胞・遺伝子治療市場規模推定と予測:治療法別
11.6 アジア太平洋地域の細胞・遺伝子治療市場規模推定と予測:適応症別
11.7 アジア太平洋地域の細胞・遺伝子治療市場規模推定と予測:ベクタータイプ別
11.8 アジア太平洋地域の細胞・遺伝子治療市場規模推定と予測:エンドユーザー別
11.9 日本の細胞・遺伝子治療市場分析
11.10 中国の細胞・遺伝子治療市場分析
11.11 インドの細胞・遺伝子治療市場分析
11.12 オーストラリアの細胞・遺伝子治療市場分析
11.13 韓国の細胞・遺伝子治療市場分析
11.14 シンガポールの細胞・遺伝子治療市場分析
11.15 その他のアジア太平洋地域の細胞・遺伝子治療市場分析
12 ラテンアメリカの細胞・遺伝子治療市場の分析
12.1 主な調査結果
12.2 ラテンアメリカの細胞・遺伝子治療市場の魅力度指数
12.3 ラテンアメリカの細胞・遺伝子治療市場国別、2026年、2031年、2036年(10億米ドル)
12.4 ラテンアメリカの細胞・遺伝子治療市場の規模推定と予測:国別
12.5 ラテンアメリカの細胞・遺伝子治療市場の規模推定と予測:治療法別
12.6 ラテンアメリカの細胞・遺伝子治療市場の規模推定と予測:適応症別
12.7 ラテンアメリカの細胞・遺伝子治療市場の規模推定と予測:ベクタータイプ別
12.8 ラテンアメリカの細胞・遺伝子治療市場の規模推定と予測:エンドユーザー別
12.9 ブラジルの細胞・遺伝子治療市場の分析
12.10 メキシコの細胞・遺伝子治療市場の分析
12.11 アルゼンチンの細胞・遺伝子治療市場の分析
12.12 その他のラテンアメリカ諸国における細胞・遺伝子治療市場の分析
13 中東・アフリカ(MEA)の細胞・遺伝子治療市場の分析
13.1 主な調査結果
13.2 MEAの細胞・遺伝子治療市場の魅力度指数
13.3 MEAの細胞・遺伝子治療市場国別、2026年、2031年、2036年(10億米ドル)
13.4 MEAの細胞・遺伝子治療市場の規模推定と予測:国別
13.5 MEAの細胞・遺伝子治療市場の規模推定と予測:治療法別
13.6 MEAの細胞・遺伝子治療市場の規模推定と予測:適応症別
13.7 MEAの細胞・遺伝子治療市場の規模推定と予測:ベクタータイプ別
13.8 MEAの細胞・遺伝子治療市場規模の推定と予測:エンドユーザー別
13.9 GCCの細胞・遺伝子治療市場分析
13.10 南アフリカ細胞・遺伝子治療市場分析
13.11 その他のMEA地域の細胞・遺伝子治療市場分析
14 主要企業のプロファイル
14.1 競合環境(2026年)
14.2 戦略的展望
14.3 Adaptimmune
14.3.1 企業概要
14.3.2 会社概要
14.3.3 財務分析
14.3.3.1 純売上高(2021年~2024年)
14.3.3.2 研究開発費(R&D)、2021-2024年
14.3.4 製品ベンチマーク
14.3.5 SWOT分析
14.3.6 戦略的展望
14.4 アロジェン・セラピューティクス(ALLOGENE THERAPEUTICS)
14.4.1 企業概要
14.4.2 会社概要
14.4.3 財務分析
14.4.3.1 純売上高、2021-2024年
14.4.3.2 研究開発(R&D)、2021-2024年
14.4.4 製品ベンチマーキング
14.4.5 SWOT分析
14.4.6 戦略的展望
14.5 アタラ・バイオセラピューティクス社
14.5.1 企業概要
14.5.2 会社概要
14.5.3 財務分析
14.5.3.1 純売上高(2021年~2024年)
14.5.3.2 研究開発費(2021年~2024年)
14.5.4 製品ベンチマーク
14.5.5 SWOT分析
14.5.6 戦略的展望
14.6 ビーム・セラピューティクス
14.6.1 企業概要
14.6.2 会社概要
14.6.3 財務分析
14.6.3.1 純売上高(2021年~2024年)
14.6.3.2 研究開発費(R&D)、2021-2024年
14.6.4 製品ベンチマーク
14.6.5 SWOT分析
14.6.6 戦略的展望
14.7 バイオマリン
14.7.1 企業概要
14.7.2 会社概要
14.7.3 財務分析
14.7.3.1 純売上高、2021-2025年
14.7.3.2 研究開発(R&D)、2021-2025年
14.7.3.3 地域別市場シェア、2025年
14.7.4 製品ベンチマーク
14.7.5 SWOT分析
14.7.6 戦略的展望
14.8 ブリストル・マイヤーズ スクイブ社
14.8.1 企業概要
14.8.2 会社概要
14.8.3 財務分析
14.8.3.1 純売上高(2021年~2025年)
14.8.3.2 研究開発費(R&D)、2021-2025年
14.8.3.3 地域別市場シェア、2024年
14.8.3.4 事業セグメント別市場シェア、2024年
14.8.4 製品ベンチマーク
14.8.5 SWOT分析
14.8.6 戦略的展望
14.9 カタレント社
14.9.1 企業概要
14.9.2 会社概要
14.9.3 財務分析
14.9.3.1 純売上高(2021年~2024年)
14.9.3.2 地域別市場シェア(2024年)
14.9.3.3 事業セグメント別市場シェア(2024年)
14.9.4 製品ベンチマーク
14.9.5 SWOT分析
14.9.6 戦略的展望
14.10 CRISPR Therapeutics
14.10.1 企業概要
14.10.2 会社概要
14.10.3 財務分析
14.10.3.1 純売上高(2021年~2025年)
14.10.3.2 研究開発費(2021年~2024年)
14.10.4 製品ベンチマーク
14.10.5 SWOT分析
14.10.6 戦略的展望
14.11 Genetix Biotherapeutics Inc.
14.11.1 企業概要
14.11.2 会社概要
14.11.3 製品ベンチマーク
14.11.4 SWOT分析
14.12 GenScript
14.12.1 企業概要
14.12.2 会社概要
14.12.3 財務分析
14.12.3.1 純売上高(2021年~2025年)
14.12.3.2 地域別市場シェア(2024年)
14.12.3.3 事業セグメント別市場シェア(2025年)
14.12.4 製品ベンチマーキング
14.12.5 SWOT分析
14.12.6 戦略的展望
14.13 ギリアド・サイエンシズ社
14.13.1 企業概要
14.13.2 会社概要
14.13.3 財務分析
14.13.3.1 純売上高(2021年~2025年)
14.13.3.2 研究開発費(2021年~2025年)
14.13.3.3 地域別市場シェア(2025年)
14.13.3.4 事業セグメント別市場シェア(2025年)
14.13.4 製品ベンチマーク
14.13.5 SWOT分析
14.13.6 戦略的展望
14.14 Intellia Therapeutics, Inc.
14.14.1 企業概要
14.14.2 会社概要
14.14.3 財務分析
14.14.3.1 純売上高(2021年~2024年)
14.14.3.2 研究開発費(2021年~2024年)
14.14.4 製品ベンチマーク
14.14.5 SWOT分析
14.14.6 戦略的展望
14.15 ジョンソン・エンド・ジョンソン
14.15.1 企業概要
14.15.2 会社概要
14.15.3 財務分析
14.15.3.1 純売上高(2021年~2025年)
14.15.3.2 研究開発費(2021年~2025年)
14.15.3.3 地域別市場シェア(2025年)
14.15.3.4 事業セグメント別市場シェア(2025年)
14.15.4 製品ベンチマーク
14.15.5 SWOT分析
14.15.6 戦略的展望
14.16 ロンザ
14.16.1 企業概要
14.16.2 企業概要
14.16.3 財務分析
14.16.3.1 純売上高(2021年~2024年)
14.16.3.2 研究開発費(2021年~2024年)
14.16.3.3 地域別市場シェア(2024年)
14.16.3.4 事業セグメント別市場シェア(2024年)
14.16.4 製品ベンチマーク
14.16.5 SWOT分析
14.16.6 戦略的展望
14.17 MeiraGTx Limited
14.17.1 企業概要
14.17.2 会社概要
14.17.3 財務分析
14.17.3.1 純売上高(2021年~2024年)
14.17.3.2 研究開発費(2021年~2024年)
14.17.4 製品ベンチマーク
14.17.5 SWOT分析
14.17.6 戦略的展望
14.18 ノバルティスAG
14.18.1 企業概要
14.18.2 会社概要
14.18.3 財務分析
14.18.3.1 純売上高(2021年~2025年)
14.18.3.2 研究開発費(2021年~2025年)
14.18.3.3 地域別市場シェア(2025年)
14.18.3.4 事業セグメント別市場シェア(2025年)
14.18.4 製品ベンチマーク
14.18.5 SWOT分析
14.18.6 戦略的展望
14.19 サレプタ・セラピューティクス社
14.19.1 企業概要
14.19.2 会社概要
14.19.3 財務分析
14.19.3.1 純売上高(2021年~2024年)
14.19.3.2 研究開発費(2021年~2024年)
14.19.3.3 事業セグメント別市場シェア(2024年)
14.19.4 製品ベンチマーク
14.19.5 SWOT分析
14.19.6 戦略的展望
14.20 ウルトラジェニックス・ファーマシューティカル社
14.20.1 企業概要
14.20.2 会社概要
14.20.3 財務分析
14.20.3.1 純売上高(2021-2025年)
14.20.3.2 研究開発費(2021-2025年)
14.20.3.3 地域別市場シェア(2025年)
14.20.4 製品ベンチマーク
14.20.5 SWOT分析
14.20.6 戦略的展望
14.21 バーテックス・ファーマシューティカルズ・インコーポレイテッド
14.21.1 企業概要
14.21.2 会社概要
14.21.3 財務分析
14.21.3.1 純売上高(2021年~2025年)
14.21.3.2 研究開発費(R&D)、2021-2025年
14.21.3.3 地域別市場シェア、2024年
14.21.4 製品ベンチマーク
14.21.5 SWOT分析
14.21.6 戦略的展望
15 結論と提言
15.1 Visiongainによる総括
15.2 市場関係者への提言
ページTOPに戻る
図表リスト
List of Tables
Table 1 Cell & Gene Therapy Market Snapshot, 2026 & 2036 (US$ Billion, CAGR %)
Table 2 Cell & Gene Therapy Market: International Trade Tariff Impact Recovery Scenarios Snapshot
Table 3 Cell & Gene Therapy Market Forecast by Region 2026-2036 (US$ Billion, AGR%, CAGR%), Tariff Impact: V- Shaped Recovery Scenario
Table 4 Cell & Gene Therapy Market Forecast by Region 2026-2036 (US$ Billion, AGR%, CAGR%), Tariff Impact: U- Shaped Recovery Scenario
Table 5 Cell & Gene Therapy Market Forecast by Region 2026-2036 (US$ Billion, AGR%, CAGR%), Tariff Impact: L- Shaped Recovery Scenario
Table 6 Cell & Gene Therapy Market Forecast by Therapy Type, 2026-2036 (US$ Billion, AGR%, CAGR%)
Table 7 Cell & Gene Therapy Market Forecast by Cell Therapy, 2026-2036 (US$ Billion, AGR%, CAGR%)
Table 8 Cell Therapy Segment Market Forecast by Region, 2026-2036 (US$ Billion, AGR%, CAGR%)
Table 9 Stem Cell Therapy Segment Market Forecast by Region, 2026-2036 (US$ Billion, AGR%, CAGR%)
Table 10 CAR-T Cell Therapy Segment Market Forecast by Region, 2026-2036 (US$ Billion, AGR%, CAGR%)
Table 11 TCR-T Cell Therapy Segment Market Forecast by Region, 2026-2036 (US$ Billion, AGR%, CAGR%)
Table 12 Others Segment Market Forecast by Region, 2026-2036 (US$ Billion, AGR%, CAGR%)
Table 13 Cell & Gene Therapy Market Forecast by Gene Therapy, 2026-2036 (US$ Billion, AGR%, CAGR%)
Table 14 Gene Therapy Segment Market Forecast by Region, 2026-2036 (US$ Billion, AGR%, CAGR%)
Table 15 Gene Augmentation Therapy Segment Market Forecast by Region, 2026-2036 (US$ Billion, AGR%, CAGR%)
Table 16 Gene Inhibition Therapy Segment Market Forecast by Region, 2026-2036 (US$ Billion, AGR%, CAGR%)
Table 17 Gene Editing Segment Market Forecast by Region, 2026-2036 (US$ Billion, AGR%, CAGR%)
Table 18 Others Segment Market Forecast by Region, 2026-2036 (US$ Billion, AGR%, CAGR%)
Table 19 Cell & Gene Therapy Market Forecast by Indication, 2026-2036 (US$ Billion, AGR%, CAGR%)
Table 20 Oncology Segment Market Forecast by Region, 2026-2036 (US$ Billion, AGR%, CAGR%)
Table 21 Genetic Disorders Segment Market Forecast by Region, 2026-2036 (US$ Billion, AGR%, CAGR%)
Table 22 Cardiovascular Disorders Segment Market Forecast by Region, 2026-2036 (US$ Billion, AGR%, CAGR%)
Table 23 Neurological Disorders Segment Market Forecast by Region, 2026-2036 (US$ Billion, AGR%, CAGR%)
Table 24 Infectious Diseases Segment Market Forecast by Region, 2026-2036 (US$ Billion, AGR%, CAGR%)
Table 25 Ophthalmic Disorders Segment Market Forecast by Region, 2026-2036 (US$ Billion, AGR%, CAGR%)
Table 26 Others Segment Market Forecast by Region, 2026-2036 (US$ Billion, AGR%, CAGR%)
Table 27 Cell & Gene Therapy Market Forecast by Vector Type, 2026-2036 (US$ Billion, AGR%, CAGR%)
Table 28 Cell & Gene Therapy Market Forecast by Viral Vectors, 2026-2036 (US$ Billion, AGR%, CAGR%)
Table 29 Viral Vectors Segment Market Forecast by Region, 2026-2036 (US$ Billion, AGR%, CAGR%)
Table 30 Retrovirus Segment Market Forecast by Region, 2026-2036 (US$ Billion, AGR%, CAGR%)
Table 31 Lentivirus Segment Market Forecast by Region, 2026-2036 (US$ Billion, AGR%, CAGR%)
Table 32 Adenovirus Segment Market Forecast by Region, 2026-2036 (US$ Billion, AGR%, CAGR%)
Table 33 AAV Segment Market Forecast by Region, 2026-2036 (US$ Billion, AGR%, CAGR%)
Table 34 Others Segment Market Forecast by Region, 2026-2036 (US$ Billion, AGR%, CAGR%)
Table 35 Non-viral vectors Segment Market Forecast by Region, 2026-2036 (US$ Billion, AGR%, CAGR%)
Table 36 Cell & Gene Therapy Market Forecast by End-user, 2026-2036 (US$ Billion, AGR%, CAGR%)
Table 37 Hospitals Segment Market Forecast by Region, 2026-2036 (US$ Billion, AGR%, CAGR%)
Table 38 Research Institutes Segment Market Forecast by Region, 2026-2036 (US$ Billion, AGR%, CAGR%)
Table 39 Pharmaceutical Companies Segment Market Forecast by Region, 2026-2036 (US$ Billion, AGR%, CAGR%)
Table 40 Others Segment Market Forecast by Region, 2026-2036 (US$ Billion, AGR%, CAGR%)
Table 41 Cell & Gene Therapy Market Forecast by Region, 2026-2036 (US$ Billion, AGR%, CAGR%)
Table 42 North America Cell & Gene Therapy Market Forecast by Country, 2026-2036 (US$ Billion, AGR%, CAGR%)
Table 43 North America Cell & Gene Therapy Market Forecast by Therapy Type, 2026-2036 (US$ Billion, AGR%, CAGR%)
Table 44 North America Cell & Gene Therapy Market Forecast by Indication, 2026-2036 (US$ Billion, AGR%, CAGR%)
Table 45 North America Cell & Gene Therapy Market Forecast by Vector Type, 2026-2036 (US$ Billion, AGR%, CAGR%)
Table 46 North America Cell & Gene Therapy Market Forecast by End-user, 2026-2036 (US$ Billion, AGR%, CAGR%)
Table 47 U.S. Cell & Gene Therapy Market Forecast, 2026-2036 (US$ Billion, AGR%, CAGR%)
Table 48 Canada Cell & Gene Therapy Market Forecast, 2026-2036 (US$ Billion, AGR%, CAGR%)
Table 49 Europe Cell & Gene Therapy Market Forecast by Country, 2026-2036 (US$ Billion, AGR%, CAGR%)
Table 50 Europe Cell & Gene Therapy Market Forecast by Therapy Type, 2026-2036 (US$ Billion, AGR%, CAGR%)
Table 51 Europe Cell & Gene Therapy Market Forecast by Indication, 2026-2036 (US$ Billion, AGR%, CAGR%)
Table 52 Europe Cell & Gene Therapy Market Forecast by Vector Type, 2026-2036 (US$ Billion, AGR%, CAGR%)
Table 53 Europe Cell & Gene Therapy Market Forecast by End-user, 2026-2036 (US$ Billion, AGR%, CAGR%)
Table 54 Germany Cell & Gene Therapy Market Forecast, 2026-2036 (US$ Billion, AGR%, CAGR%)
Table 55 France Cell & Gene Therapy Market Forecast, 2026-2036 (US$ Billion, AGR%, CAGR%)
Table 56 UK Cell & Gene Therapy Market Forecast, 2026-2036 (US$ Billion, AGR%, CAGR%)
Table 57 Italy Cell & Gene Therapy Market Forecast, 2026-2036 (US$ Billion, AGR%, CAGR%)
Table 58 Spain Cell & Gene Therapy Market Forecast, 2026-2036 (US$ Million, AGR%, CAGR%)
Table 59 Russia Cell & Gene Therapy Market Forecast, 2026-2036 (US$ Billion, AGR%, CAGR%)
Table 60 Rest of Europe Cell & Gene Therapy Market Forecast, 2026-2036 (US$ Billion, AGR%, CAGR%)
Table 61 Asia-Pacific Cell & Gene Therapy Market Forecast by Country, 2026-2036 (US$ Billion, AGR%, CAGR%)
Table 62 Asia Pacific Cell & Gene Therapy Market Forecast by Therapy Type, 2026-2036 (US$ Billion, AGR%, CAGR%)
Table 63 Asia Pacific Cell & Gene Therapy Market Forecast by Indication, 2026-2036 (US$ Billion, AGR%, CAGR%)
Table 64 Asia Pacific Cell & Gene Therapy Market Forecast by Vector Type, 2026-2036 (US$ Billion, AGR%, CAGR%)
Table 65 Asia Pacific Cell & Gene Therapy Market Forecast by End-user, 2026-2036 (US$ Billion, AGR%, CAGR%)
Table 66 Japan Cell & Gene Therapy Market Forecast, 2026-2036 (US$ Billion, AGR%, CAGR%)
Table 67 China Cell & Gene Therapy Market Forecast, 2026-2036 (US$ Billion, AGR%, CAGR%)
Table 68 India Cell & Gene Therapy Market Forecast, 2026-2036 (US$ Billion, AGR%, CAGR%)
Table 69 Australia Cell & Gene Therapy Market Forecast, 2026-2036 (US$ Billion, AGR%, CAGR%)
Table 70 South Korea Cell & Gene Therapy Market Forecast, 2026-2036 (US$ Billion, AGR%, CAGR%)
Table 71 Singapore Cell & Gene Therapy Market Forecast, 2026-2036 (US$ Billion, AGR%, CAGR%)
Table 72 Rest of Asia Pacific Cell & Gene Therapy Market Forecast, 2026-2036 (US$ Billion, AGR%, CAGR%)
Table 73 Latin America Cell & Gene Therapy Market Forecast by Country, 2026-2036 (US$ Billion, AGR%, CAGR%)
Table 74 Latin America Cell & Gene Therapy Market Forecast by Therapy Type, 2026-2036 (US$ Billion, AGR%, CAGR%)
Table 75 Latin America Cell & Gene Therapy Market Forecast by Indication, 2026-2036 (US$ Billion, AGR%, CAGR%)
Table 76 Latin America Cell & Gene Therapy Market Forecast by Vector Type, 2026-2036 (US$ Billion, AGR%, CAGR%)
Table 77 Latin America Cell & Gene Therapy Market Forecast by End-user, 2026-2036 (US$ Billion, AGR%, CAGR%)
Table 78 Brazil Cell & Gene Therapy Market Forecast, 2026-2036 (US$ Billion, AGR%, CAGR%)
Table 79 Mexico Cell & Gene Therapy Market Forecast, 2026-2036 (US$ Billion, AGR%, CAGR%)
Table 80 Argentina Cell & Gene Therapy Market Forecast, 2026-2036 (US$ Billion, AGR%, CAGR%)
Table 81 Rest of Latin America Cell & Gene Therapy Market Forecast, 2026-2036 (US$ Billion, AGR%, CAGR%)
Table 82 MEA Cell & Gene Therapy Market Forecast by Country, 2026-2036 (US$ Billion, AGR%, CAGR%)
Table 83 MEA Cell & Gene Therapy Market Forecast by Therapy Type, 2026-2036 (US$ Billion, AGR%, CAGR%)
Table 84 MEA Cell & Gene Therapy Market Forecast by Indication, 2026-2036 (US$ Billion, AGR%, CAGR%)
Table 85 MEA Cell & Gene Therapy Market Forecast by Vector Type, 2026-2036 (US$ Billion, AGR%, CAGR%)
Table 86 MEA Cell & Gene Therapy Market Forecast by End-user, 2026-2036 (US$ Billion, AGR%, CAGR%)
Table 87 GCC Cell & Gene Therapy Market Forecast, 2026-2036 (US$ Billion, AGR%, CAGR%)
Table 88 South Africa Cell & Gene Therapy Market Forecast, 2026-2036 (US$ Billion, AGR%, CAGR%)
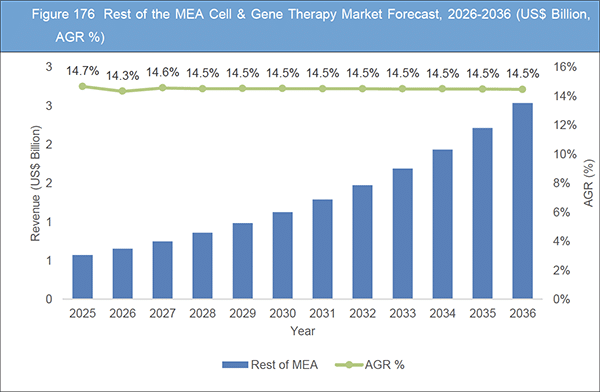
Table 89 Rest of the MEA Cell & Gene Therapy Market Forecast, 2026-2036 (US$ Billion, AGR%, CAGR%)
Table 90 Strategic Outlook
Table 91 Adaptimmune: Key Details, (CEO, HQ, Revenue, Founded, No. of Employees, Company Type, Website, Business Segment)
Table 92 Adaptimmune: Product Benchmarking
Table 93 Adaptimmune: SWOT Analysis
Table 94 Adaptimmune: Strategic Outlook
Table 95 ALLOGENE THERAPEUTICS: Key Details, (CEO, HQ, Revenue, Founded, No. of Employees, Company Type, Website, Business Segment)
Table 96 ALLOGENE THERAPEUTICS: Product Benchmarking
Table 97 ALLOGENE THERAPEUTICS: SWOT Analysis
Table 98 ALLOGENE THERAPEUTICS: Strategic Outlook
Table 99 Atara Biotherapeutics, Inc.: Key Details, (CEO, HQ, Revenue, Founded, No. of Employees, Company Type, Website, Business Segment)
Table 100 Atara Biotherapeutics: Product Benchmarking
Table 101 Atara Biotherapeutics: SWOT Analysis
Table 102 Atara Biotherapeutics: Strategic Outlook
Table 103 Beam Therapeutics: Key Details, (CEO, HQ, Revenue, Founded, No. of Employees, Company Type, Website, Business Segment)
Table 104 Beam Therapeutics: Product Benchmarking
Table 105 Beam Therapeutics: SWOT Analysis
Table 106 Beam Therapeutics: Strategic Outlook
Table 107 BioMarin: Key Details, (CEO, HQ, Revenue, Founded, No. of Employees, Company Type, Website, Business Segment)
Table 108 BioMarin: Product Benchmarking
Table 109 BioMarin: SWOT Analysis
Table 110 BioMarin: Strategic Outlook
Table 111 Bristol-Myers Squibb Company: Key Details, (CEO, HQ, Revenue, Founded, No. of Employees, Company Type, Website, Business Segment)
Table 112 Bristol-Myers Squibb Company: Product Benchmarking
Table 113 Bristol-Myers Squibb: SWOT Analysis
Table 114 Bristol-Myers Squibb: Strategic Outlook
Table 115 Catalent, Inc: Key Details, (CEO, HQ, Revenue, Founded, No. of Employees, Company Type, Website, Business Segment)
Table 116 Catalent, Inc: Product Benchmarking
Table 117 Catalent, Inc: SWOT Analysis
Table 118 Catalent, Inc: Strategic Outlook
Table 119 CRISPR Therapeutics: Key Details, (CEO, HQ, Revenue, Founded, No. of Employees, Company Type, Website, Business Segment)
Table 120 CRISPR Therapeutics: Product Benchmarking
Table 121 CRISPR Therapeutics: SWOT Analysis
Table 122 CRISPR Therapeutics: Strategic Outlook
Table 123 Genetix Biotherapeutics Inc.: Key Details, (CEO, HQ, Revenue, Founded, No. of Employees, Company Type, Website, Business Segment)
Table 124 Genetix Biotherapeutics Inc.: Product Benchmarking
Table 125 Genetix Biotherapeutics Inc.: SWOT Analysis
Table 126 GenScript: Key Details, (CEO, HQ, Revenue, Founded, No. of Employees, Company Type, Website, Business Segment)
Table 127 GenScript: Product Benchmarking
Table 128 GenScript: SWOT Analysis
Table 129 Genetix Biotherapeutics Inc.: Strategic Outlook
Table 130 Gilead Sciences, Inc.: Key Details, (CEO, HQ, Revenue, Founded, No. of Employees, Company Type, Website, Business Segment)
Table 131 Gilead Sciences, Inc.: Product Benchmarking
Table 132 Gilead Sciences, Inc.: SWOT Analysis
Table 133 Gilead Sciences, Inc.: Strategic Outlook
Table 134 Intellia Therapeutics, Inc.: Key Details, (CEO, HQ, Revenue, Founded, No. of Employees, Company Type, Website, Business Segment)
Table 135 Intellia Therapeutics, Inc.: Product Benchmarking
Table 136 Intellia Therapeutics, Inc.: SWOT Analysis
Table 137 Intellia Therapeutics, Inc.: Strategic Outlook
Table 138 Johnson & Johnson: Key Details, (CEO, HQ, Revenue, Founded, No. of Employees, Company Type, Website, Business Segment)
Table 139 Johnson & Johnson: Product Benchmarking
Table 140 Johnson & Johnson: SWOT Analysis
Table 141 Johnson & Johnson: Strategic Outlook
Table 142 Lonza: Key Details, (CEO, HQ, Revenue, Founded, No. of Employees, Company Type, Website, Business Segment)
Table 143 Lonza: Product Benchmarking
Table 144 Lonza: SWOT Analysis
Table 145 Lonza: Strategic Outlook
Table 146 MeiraGTx Limited: Key Details, (CEO, HQ, Revenue, Founded, No. of Employees, Company Type, Website, Business Segment)
Table 147 MeiraGTx Limited: Product Benchmarking
Table 148 MeiraGTx Limited: SWOT Analysis
Table 149 MeiraGTx Limited: Strategic Outlook
Table 150 Novartis AG: Key Details, (CEO, HQ, Revenue, Founded, No. of Employees, Company Type, Website, Business Segment)
Table 151 Novartis AG: Product Benchmarking
Table 152 Novartis AG: SWOT Analysis
Table 153 Novartis AG: Strategic Outlook
Table 154 Sarepta Therapeutics, Inc.: Key Details, (CEO, HQ, Revenue, Founded, No. of Employees, Company Type, Website, Business Segment)
Table 155 Sarepta Therapeutics, Inc.: Product Benchmarking
Table 156 Sarepta Therapeutics, Inc.: SWOT Analysis
Table 157 Sarepta Therapeutics, Inc.: Strategic Outlook
Table 158 Ultragenyx Pharmaceutical Inc.: Key Details, (CEO, HQ, Revenue, Founded, No. of Employees, Company Type, Website, Business Segment)
Table 159 Ultragenyx Pharmaceutical Inc.: Product Benchmarking
Table 160 Ultragenyx Pharmaceutical Inc.: SWOT Analysis
Table 161 Ultragenyx Pharmaceutical Inc.: Strategic Outlook
Table 162 Vertex Pharmaceuticals Incorporated: Key Details, (CEO, HQ, Revenue, Founded, No. of Employees, Company Type, Website, Business Segment)
Table 163 Vertex Pharmaceuticals Incorporated: Product Benchmarking
Table 164 Vertex Pharmaceuticals Incorporated: SWOT Analysis
Table 165 Vertex Pharmaceuticals Incorporated: Strategic Outlook
List of Figures
Figure 1 Cell & Gene Therapy Market Segmentation
Figure 2 Cell & Gene Therapy Market by Therapy Type: Market Attractiveness Index
Figure 3 Cell & Gene Therapy Market by Indication: Market Attractiveness Index
Figure 4 Cell & Gene Therapy Market by Vector Type: Market Attractiveness Index
Figure 5 Cell & Gene Therapy Market by End User: Market Attractiveness Index
Figure 6 Cell & Gene Therapy Market Attractiveness Index by Region
Figure 7 Cell & Gene Therapy Market: Market Dynamics
Figure 8 Cell & Gene Therapy Market: Impact Analysis
Figure 9 Cell & Gene Therapy Market by Region, 2026-2036 (US$ Billion, AGR %), Tariff Impact: V-Shaped Recovery Scenario
Figure 10 Cell & Gene Therapy Market by Region, 2026-2036 (US$ Billion, AGR %), Tariff Impact: U-Shaped Recovery Scenario
Figure 11 Cell & Gene Therapy Market by Region, 2026-2036 (US$ Billion, AGR %), Tariff Impact: L-Shaped Recovery Scenario
Figure 12 Short Term & Long Term Planning
Figure 13 Impact of U.S. and China Trade War
Figure 14 Most Impacted Countries
Figure 15 Global Market Tariff Sensitivity and Margin Pressure Analysis
Figure 16 Cell & Gene Therapy Market: Porter’s Five Forces Analysis
Figure 17 Cell & Gene Therapy Market: PEST Analysis
Figure 18 Cell & Gene Therapy Market by Therapy Type: Market Attractiveness Index
Figure 19 Cell & Gene Therapy Market Forecast by Therapy Type, 2026-2036 (US$ Billion, AGR %)
Figure 20 Cell & Gene Therapy Market Share Forecast by Therapy Type, 2026, 2031, 2036 (%)
Figure 21 Cell Therapy Segment Market Forecast by Region, 2026-2036 (US$ Billion, AGR %)
Figure 22 Cell Therapy Segment Market Share Forecast by Region, 2026 & 2036 (%)
Figure 23 Stem Cell Therapy Segment Market Forecast by Region, 2026-2036 (US$ Billion, AGR %)
Figure 24 Stem Cell Therapy Segment Market Share Forecast by Region, 2026 & 2036 (%)
Figure 25 CAR-T Cell Therapy Segment Market Forecast by Region, 2026-2036 (US$ Billion, AGR %)
Figure 26 CAR-T Cell Therapy Segment Market Share Forecast by Region, 2026 & 2036 (%)
Figure 27 TCR-T Cell Therapy Segment Market Forecast by Region, 2026-2036 (US$ Billion, AGR %)
Figure 28 TCR-T Cell Therapy Segment Market Share Forecast by Region, 2026 & 2036 (%)
Figure 29 Others Segment Market Forecast by Region, 2026-2036 (US$ Billion, AGR %)
Figure 30 Others Segment Market Share Forecast by Region, 2026 & 2036 (%)
Figure 31 Gene Therapy Segment Market Forecast by Region, 2026-2036 (US$ Billion, AGR %)
Figure 32 Gene Therapy Segment Market Share Forecast by Region, 2026 & 2036 (%)
Figure 33 Gene Augmentation Therapy Segment Market Forecast by Region, 2026-2036 (US$ Billion, AGR %)
Figure 34 Gene Augmentation Therapy Segment Market Share Forecast by Region, 2026 & 2036 (%)
Figure 35 Gene Inhibition Therapy Segment Market Forecast by Region, 2026-2036 (US$ Billion, AGR %)
Figure 36 Gene Inhibition Therapy Segment Market Share Forecast by Region, 2026 & 2036 (%)
Figure 37 Gene Editing Segment Market Forecast by Region, 2026-2036 (US$ Billion, AGR %)
Figure 38 Gene Editing Segment Market Share Forecast by Region, 2026 & 2036 (%)
Figure 39 Others Segment Market Forecast by Region, 2026-2036 (US$ Billion, AGR %)
Figure 40 Others Segment Market Share Forecast by Region, 2026 & 2036 (%)
Figure 41 Cell & Gene Therapy Market by Indication: Market Attractiveness Index
Figure 42 Cell & Gene Therapy Market Forecast by Indication, 2026-2036 (US$ Billion, AGR %)
Figure 43 Cell & Gene Therapy Market Share Forecast by Indication, 2026, 2031, 2036 (%)
Figure 44 Oncology Segment Market Forecast by Region, 2026-2036 (US$ Billion, AGR %)
Figure 45 Oncology Segment Market Share Forecast by Region, 2026 & 2036 (%)
Figure 46 Genetic Disorders Segment Market Forecast by Region, 2026-2036 (US$ Billion, AGR %)
Figure 47 Genetic Disorders Segment Market Share Forecast by Region, 2026 & 2036 (%)
Figure 48 Cardiovascular Disorders Segment Market Forecast by Region, 2026-2036 (US$ Billion, AGR %)
Figure 49 Cardiovascular Disorders Segment Market Share Forecast by Region, 2026 & 2036 (%)
Figure 50 Neurological Disorders Segment Market Forecast by Region, 2026-2036 (US$ Billion, AGR %)
Figure 51 Neurological Disorders Segment Market Share Forecast by Region, 2026 & 2036 (%)
Figure 52 Infectious Diseases Segment Market Forecast by Region, 2026-2036 (US$ Billion, AGR %)
Figure 53 Infectious Diseases Segment Market Share Forecast by Region, 2026 & 2036 (%)
Figure 54 Ophthalmic Disorders Segment Market Forecast by Region, 2026-2036 (US$ Billion, AGR %)
Figure 55 Ophthalmic Disorders Segment Market Share Forecast by Region, 2026 & 2036 (%)
Figure 56 Others Segment Market Forecast by Region, 2026-2036 (US$ Billion, AGR %)
Figure 57 Others Segment Market Share Forecast by Region, 2026 & 2036 (%)
Figure 58 Cell & Gene Therapy Market by Vector Type: Market Attractiveness Index
Figure 59 Cell & Gene Therapy Market Forecast by Vector Type, 2026-2036 (US$ Billion, AGR %)
Figure 60 Cell & Gene Therapy Market Share Forecast by Vector Type, 2026, 2031, 2036 (%)
Figure 61 Viral Vectors Segment Market Forecast by Region, 2026-2036 (US$ Billion, AGR %)
Figure 62 Viral Vectors Segment Market Share Forecast by Region, 2026 & 2036 (%)
Figure 63 Retrovirus Segment Market Forecast by Region, 2026-2036 (US$ Billion, AGR %)
Figure 64 Retrovirus Segment Market Share Forecast by Region, 2026 & 2036 (%)
Figure 65 Lentivirus Segment Market Forecast by Region, 2026-2036 (US$ Billion, AGR %)
Figure 66 Lentivirus Segment Market Share Forecast by Region, 2026 & 2036 (%)
Figure 67 Adenovirus Segment Market Forecast by Region, 2026-2036 (US$ Billion, AGR %)
Figure 68 Adenovirus Segment Market Share Forecast by Region, 2026 & 2036 (%)
Figure 69 AAV Segment Market Forecast by Region, 2026-2036 (US$ Billion, AGR %)
Figure 70 AAV Segment Market Share Forecast by Region, 2026 & 2036 (%)
Figure 71 Others Segment Market Forecast by Region, 2026-2036 (US$ Billion, AGR %)
Figure 72 Others Segment Market Share Forecast by Region, 2026 & 2036 (%)
Figure 73 Non-viral vectors Segment Market Forecast by Region, 2026-2036 (US$ Billion, AGR %)
Figure 74 Non-viral vectors Segment Market Share Forecast by Region, 2026 & 2036 (%)
Figure 75 Cell & Gene Therapy Market by End-user: Market Attractiveness Index
Figure 76 Cell & Gene Therapy Market Forecast by End-user, 2026-2036 (US$ Billion, AGR %)
Figure 77 Cell & Gene Therapy Market Share Forecast by End-user, 2026, 2031, 2036 (%)
Figure 78 Hospitals Segment Market Forecast by Region, 2026-2036 (US$ Billion, AGR %)
Figure 79 Hospitals Segment Market Share Forecast by Region, 2026 & 2036 (%)
Figure 80 Research Institutes Segment Market Forecast by Region, 2026-2036 (US$ Billion, AGR %)
Figure 81 Research Institutes Segment Market Share Forecast by Region, 2026 & 2036 (%)
Figure 82 Pharmaceutical Companies Segment Market Forecast by Region, 2026-2036 (US$ Billion, AGR %)
Figure 83 Pharmaceutical Companies Segment Market Share Forecast by Region, 2026 & 2036 (%)
Figure 84 Others Segment Market Forecast by Region, 2026-2036 (US$ Billion, AGR %)
Figure 85 Others Segment Market Share Forecast by Region, 2026 & 2036 (%)
Figure 86 Cell & Gene Therapy Market Forecast by Region 2025 and 2035 (Revenue, CAGR%)
Figure 87 Cell & Gene Therapy Market Share Forecast by Region 2026, 2031, 2036 (%)
Figure 88 Cell & Gene Therapy Market by Region, 2026-2036 (US$ Billion, AGR %)
Figure 89 North America Cell & Gene Therapy Market Attractiveness Index
Figure 90 North America Cell & Gene Therapy Market by Region, 2026, 2031 & 2036 (US$ Billion)
Figure 91 North America Cell & Gene Therapy Market Forecast by Country, 2026-2036 (US$ Billion, AGR %)
Figure 92 North America Cell & Gene Therapy Market Share Forecast by Country, 2026 & 2036 (%)
Figure 93 North America Cell & Gene Therapy Market Forecast by Therapy Type, 2026-2036 (US$ Billion, AGR %)
Figure 94 North America Cell & Gene Therapy Market Share Forecast by Therapy Type, 2026 & 2036 (%)
Figure 95 North America Cell & Gene Therapy Market Forecast by Indication, 2026-2036 (US$ Billion, AGR %)
Figure 96 North America Cell & Gene Therapy Market Share Forecast by Indication, 2026 & 2036 (%)
Figure 97 North America Cell & Gene Therapy Market Forecast by Vector Type, 2026-2036 (US$ Billion, AGR %)
Figure 98 North America Cell & Gene Therapy Market Share Forecast by Vector Type, 2026 & 2036 (%)
Figure 99 North America Cell & Gene Therapy Market Forecast by End-user, 2026-2036 (US$ Billion, AGR %)
Figure 100 North America Cell & Gene Therapy Market Share Forecast by End-user, 2026 & 2036 (%)
Figure 101 U.S. Cell & Gene Therapy Market Forecast, 2026-2036 (US$ Billion, AGR %)
Figure 102 Canada Cell & Gene Therapy Market Forecast, 2026-2036 (US$ Billion, AGR %)
Figure 103 Europe Cell & Gene Therapy Market Attractiveness Index
Figure 104 Europe Cell & Gene Therapy Market by Region, 2026, 2031 & 2036 (US$ Billion)
Figure 105 Europe Cell & Gene Therapy Market Forecast by Country, 2026-2036 (US$ Billion, AGR %)
Figure 106 Europe Cell & Gene Therapy Market Share Forecast by Country, 2026 & 2036 (%)
Figure 107 Europe Cell & Gene Therapy Market Forecast by Therapy Type, 2026-2036 (US$ Billion, AGR %)
Figure 108 Europe Cell & Gene Therapy Market Share Forecast by Therapy Type, 2026 & 2036 (%)
Figure 109 Europe Cell & Gene Therapy Market Forecast by Indication, 2026-2036 (US$ Billion, AGR %)
Figure 110 Europe Cell & Gene Therapy Market Share Forecast by Indication, 2026 & 2036 (%)
Figure 111 Europe Cell & Gene Therapy Market Forecast by Vector Type, 2026-2036 (US$ Billion, AGR %)
Figure 112 Europe Cell & Gene Therapy Market Share Forecast by Vector Type, 2026 & 2036 (%)
Figure 113 Europe Cell & Gene Therapy Market Forecast by End-user, 2026-2036 (US$ Billion, AGR %)
Figure 114 Europe Cell & Gene Therapy Market Share Forecast by End-user, 2026 & 2036 (%)
Figure 115 Germany Cell & Gene Therapy Market Forecast, 2026-2036 (US$ Billion, AGR %)
Figure 116 France Cell & Gene Therapy Market Forecast, 2026-2036 (US$ Billion, AGR %)
Figure 117 UK Cell & Gene Therapy Market Forecast, 2026-2036 (US$ Billion, AGR %)
Figure 118 Italy Cell & Gene Therapy Market Forecast, 2026-2036 (US$ Billion, AGR %)
Figure 119 Spain Cell & Gene Therapy Market Forecast, 2026-2036 (US$ Billion, AGR %)
Figure 120 Russia Cell & Gene Therapy Market Forecast, 2026-2036 (US$ Billion, AGR %)
Figure 121 Rest of Europe Cell & Gene Therapy Market Forecast, 2026-2036 (US$ Billion, AGR %)
Figure 122 Asia Pacific Cell & Gene Therapy Market Attractiveness Index
Figure 123 Asia Pacific Cell & Gene Therapy Market by Region, 2026, 2031 & 2036 (US$ Billion)
Figure 124 Asia Pacific Cell & Gene Therapy Market Forecast by Country, 2026-2036 (US$ Billion, AGR %)
Figure 125 Asia Pacific Cell & Gene Therapy Market Share Forecast by Country, 2026 & 2036 (%)
Figure 126 Asia Pacific Cell & Gene Therapy Market Forecast by Therapy Type, 2026-2036 (US$ Billion, AGR %)
Figure 127 Asia Pacific Cell & Gene Therapy Market Share Forecast by Therapy Type, 2026 & 2036 (%)
Figure 128 Asa Pacific Cell & Gene Therapy Market Forecast by Indication, 2026-2036 (US$ Billion, AGR %)
Figure 129 Asia Pacific Cell & Gene Therapy Market Share Forecast by Indication, 2026 & 2036 (%)
Figure 130 Asia Pacific Cell & Gene Therapy Market Forecast by Vector Type, 2026-2036 (US$ Billion, AGR %)
Figure 131 Asia Pacific Cell & Gene Therapy Market Share Forecast by Vector Type, 2026 & 2036 (%)
Figure 132 Asia Pacific Cell & Gene Therapy Market Forecast by End-user, 2026-2036 (US$ Billion, AGR %)
Figure 133 Asia Pacific Cell & Gene Therapy Market Share Forecast by End-user, 2026 & 2036 (%)
Figure 134 Japan Cell & Gene Therapy Market Forecast, 2026-2036 (US$ Billion, AGR %)
Figure 135 China Cell & Gene Therapy Market Forecast, 2026-2036 (US$ Billion, AGR %)
Figure 136 India Cell & Gene Therapy Market Forecast, 2026-2036 (US$ Billion, AGR %)
Figure 137 Australia Cell & Gene Therapy Market Forecast, 2026-2036 (US$ Billion, AGR %)
Figure 138 South Korea Cell & Gene Therapy Market Forecast, 2026-2036 (US$ Billion, AGR %)
Figure 139 Singapore Cell & Gene Therapy Market Forecast, 2026-2036 (US$ Billion, AGR %)
Figure 140 Rest of Asia Pacific Cell & Gene Therapy Market Forecast, 2026-2036 (US$ Billion, AGR %)
Figure 141 Latin America Cell & Gene Therapy Market Attractiveness Index
Figure 142 Latin America Cell & Gene Therapy Market by Region, 2026, 2031 & 2036 (US$ Billion)
Figure 143 Latin America Cell & Gene Therapy Market Forecast by Country, 2026-2036 (US$ Billion, AGR %)
Figure 144 Latin America Cell & Gene Therapy Market Share Forecast by Country, 2026 & 2036 (%)
Figure 145 Latin America Cell & Gene Therapy Market Forecast by Therapy Type, 2026-2036 (US$ Billion, AGR %)
Figure 146 Latin America Cell & Gene Therapy Market Share Forecast by Therapy Type, 2026 & 2036 (%)
Figure 147 Latin America Cell & Gene Therapy Market Forecast by Indication, 2026-2036 (US$ Billion, AGR %)
Figure 148 Latin America Cell & Gene Therapy Market Share Forecast by Indication, 2026 & 2036 (%)
Figure 149 Latin America Cell & Gene Therapy Market Forecast by Vector Type, 2026-2036 (US$ Billion, AGR %)
Figure 150 Latin America Cell & Gene Therapy Market Share Forecast by Vector Type, 2026 & 2036 (%)
Figure 151 Latin America Cell & Gene Therapy Market Forecast by End-user, 2026-2036 (US$ Billion, AGR %)
Figure 152 Latin America Cell & Gene Therapy Market Share Forecast by End-user, 2026 & 2036 (%)
Figure 153 Brazil Cell & Gene Therapy Market Forecast, 2026-2036 (US$ Billion, AGR %)
Figure 154 Mexico Cell & Gene Therapy Market Forecast, 2026-2036 (US$ Billion, AGR %)
Figure 155 Argentina Cell & Gene Therapy Market Forecast, 2026-2036 (US$ Billion, AGR %)
Figure 156 Rest of Latin America Cell & Gene Therapy Market Forecast, 2026-2036 (US$ Billion, AGR %)
Figure 157 MEA Cell & Gene Therapy Market Attractiveness Index
Figure 158 MEA Cell & Gene Therapy Market by Region, 2026, 2031 & 2036 (US$ Billion)
Figure 159 MEA Cell & Gene Therapy Market Forecast by Country, 2026-2036 (US$ Billion, AGR %)
Figure 160 MEA Cell & Gene Therapy Market Share Forecast by Country, 2026 & 2036 (%)
Figure 161 MEA Cell & Gene Therapy Market Forecast by Therapy Type, 2026-2036 (US$ Billion, AGR %)
Figure 162 MEA Cell & Gene Therapy Market Share Forecast by Therapy Type, 2026 & 2036 (%)
Figure 163 MEA Cell & Gene Therapy Market Forecast by Indication, 2026-2036 (US$ Billion, AGR %)
Figure 164 MEA Cell & Gene Therapy Market Share Forecast by Indication, 2026 & 2036 (%)
Figure 165 MEA Cell & Gene Therapy Market Forecast by Vector Type, 2026-2036 (US$ Billion, AGR %)
Figure 166 MEA & Gene Therapy Market Share Forecast by Vector Type, 2026 & 2036 (%)
Figure 167 MEA Cell & Gene Therapy Market Forecast by End-user, 2026-2036 (US$ Billion, AGR %)
Figure 168 MEA Cell & Gene Therapy Market Share Forecast by End-user, 2026 & 2036 (%)
Figure 169 GCC Cell & Gene Therapy Market Forecast, 2026-2036 (US$ Billion, AGR %)
Figure 170 South Africa Cell & Gene Therapy Market Forecast, 2026-2036 (US$ Billion, AGR %)
Figure 171 Rest of the MEA Cell & Gene Therapy Market Forecast, 2026-2036 (US$ Billion, AGR %)
Figure 172 Cell & Gene Therapy Market: Company Share/Ranking, 2026
Figure 173 Adaptimmune: Net Revenue, 2021-2024 (US$ Million, AGR%)
Figure 174 Adaptimmune: R&D, 2021-2024 (US$ Million, AGR%)
Figure 175 ALLOGENE THERAPEUTICS: Net Revenue, 2021-2024 (US$ Million, AGR%)
Figure 176 ALLOGENE THERAPEUTICS: R&D, 2021-2024 (US$ Million, AGR%)
Figure 177 Atara Biotherapeutics: Net Revenue, 2021-2024 (US$ Million, AGR%)
Figure 178 Atara Biotherapeutics: R&D, 2021-2024 (US$ Million, AGR%)
Figure 179 Beam Therapeutics: Net Revenue, 2021-2024 (US$ Million, AGR%)
Figure 180 Beam Therapeutics: R&D, 2021-2024 (US$ Million, AGR%)
Figure 181 BioMarin: Net Revenue, 2021-2025 (US$ Million, AGR%)
Figure 182 BioMarin: R&D, 2021-2025 (US$ Million, AGR%)
Figure 183 BioMarin: Regional Market Shares, 2025
Figure 184 Bristol-Myers Squibb Company.: Net Revenue, 2021-2025 (US$ Million, AGR%)
Figure 185 Bristol-Myers Squibb Company: R&D, 2021-2025 (US$ Million, AGR%)
Figure 186 Bristol-Myers Squibb Company: Regional Market Shares, 2024
Figure 187 Bristol-Myers Squibb Company: Business Segment Market Shares, 2024
Figure 188 Catalent Inc.: Net Revenue, 2021-2024 (US$ Million, AGR%)
Figure 189 Catalent Inc: Regional Market Shares, 2024
Figure 190 Catalent Inc: Business Segment Market Shares, 2024
Figure 191 CRISPR Therapeutics.: Net Revenue, 2021-2025 (US$ Million, AGR%)
Figure 192 CRISPR Therapeutics.: R&D, 2021-2024 (US$ Million, AGR%)
Figure 193 GenScript.: Net Revenue, 2021-2025 (US$ Million, AGR%)
Figure 194 GenScript: Regional Market Shares, 2024
Figure 195 GenScript: Business Segment Market Shares, 2025
Figure 196 Gilead Sciences, Inc.: Net Revenue, 2021-2025 (US$ Million, AGR%)
Figure 197 Gilead Sciences, Inc.: R&D, 2021-2025 (US$ Million, AGR%)
Figure 198 Gilead Sciences, Inc.: Regional Market Shares, 2025
Figure 199 Gilead Sciences, Inc.: Business Segment Market Shares, 2025
Figure 200 Intellia Therapeutics, Inc.: Net Revenue, 2021-2024 (US$ Million, AGR%)
Figure 201 Intellia Therapeutics, Inc.: R&D, 2021-2024 (US$ Million, AGR%)
Figure 202 Johnson & Johnson.: Net Revenue, 2021-2025 (US$ Million, AGR%)
Figure 203 Johnson & Johnson: R&D, 2021-2025 (US$ Million, AGR%)
Figure 204 Johnson & Johnson: Regional Market Shares, 2025
Figure 205 Johnson & Johnson: Business Segment Market Shares, 2025
Figure 206 Lonza: Net Revenue, 2021-2024 (US$ Million, AGR%)
Figure 207 Lonza: R&D, 2021-2024 (US$ Million, AGR%)
Figure 208 Lonza: Regional Market Shares, 2024
Figure 209 Lonza: Business Segment Market Shares, 2024
Figure 210 MeiraGTx Limited: Net Revenue, 2021-2024 (US$ Million, AGR%)
Figure 211 MeiraGTx Limited: R&D, 2021-2024 (US$ Million, AGR%)
Figure 212 Novartis AG.: Net Revenue, 2021-2025 (US$ Million, AGR%)
Figure 213 Novartis AG: R&D, 2021-2025 (US$ Million, AGR%)
Figure 214 Novartis AG: Regional Market Shares, 2025
Figure 215 Novartis AG: Business Segment Market Shares, 2025
Figure 216 Sarepta Therapeutics, Inc.: Net Revenue, 2021-2024 (US$ Million, AGR%)
Figure 217 Sarepta Therapeutics, Inc.: R&D, 2021-2024 (US$ Million, AGR%)
Figure 218 Sarepta Therapeutics, Inc.: Business Segment Market Shares, 2024
Figure 219 Ultragenyx Pharmaceutical Inc.: Net Revenue, 2021-2025 (US$ Million, AGR%)
Figure 220 Ultragenyx Pharmaceutical Inc.: R&D, 2021-2025 (US$ Million, AGR%)
Figure 221 Ultragenyx Pharmaceutical Inc.: Regional Market Shares, 2025
Figure 222 Vertex Pharmaceuticals Incorporated: Net Revenue, 2021-2025 (US$ Million, AGR%)
Figure 223 Vertex Pharmaceuticals Incorporated: R&D, 2021-2025 (US$ Million, AGR%)
Figure 224 Vertex Pharmaceuticals Incorporated: Regional Market Shares, 2024
ページTOPに戻る
Summary
Description
The global Cell & Gene Therapy market is expected to grow from US$25.78 billion in 2026 to US$126.86 billion by 2036, at a CAGR of 17.3%, representing strong expansion as advanced therapies move further into commercial use.
Growth is driven by rising prevalence of genetic and chronic diseases, continued progress in genomic science, and increasing clinical adoption of potentially curative therapies across oncology and rare diseases.
Technological Innovation Driving Market Expansion
Advances in gene editing, viral vector development, and cell engineering are reshaping the cell & gene therapy market. Technologies such as CRISPR-based editing and next-generation CAR-T therapies are improving precision, scalability, and clinical outcomes.
At the same time, improvements in manufacturing processes and automation are helping to reduce production complexity, enabling broader commercialisation. Integration of genomic data and personalised medicine approaches is also expanding the range of treatable conditions.
Rising Incidence of Genetic Disorders Driving Market Demand
The increasing global burden of genetic and congenital disorders continues to support demand for cell & gene therapies. These treatments offer the ability to target underlying disease mechanisms rather than manage symptoms, positioning them as a transformative approach in modern medicine.
Improved diagnostics and screening are enabling earlier identification of genetic conditions, supporting patient stratification and accelerating clinical development pipelines.
High Treatment Costs Limiting Market Adoption
High upfront costs remain a key restraint. Many therapies exceed US$2 million per patient, creating affordability challenges for healthcare systems and payers.
Reimbursement frameworks are still evolving, with outcomes-based and instalment payment models gaining traction but not yet widely adopted. Delays in reimbursement decisions and limited treatment infrastructure continue to impact patient access and market uptake.
Trade, Policy & Supply Chain Dynamics
The cell & gene therapy market depends on complex global supply chains for specialised materials, reagents, and manufacturing equipment.
U.S. trade tariffs may increase costs for imported inputs and create supply chain uncertainty, particularly for smaller biotechnology firms. These pressures can affect development timelines, manufacturing capacity, and overall commercial scalability.
Commercial Impact
-
Cost and pricing pressure: High therapy costs and input prices are shaping market access
-
Supply chain shifts: Companies are investing in resilient and localised manufacturing
-
Regulatory influence: Approval processes and reimbursement frameworks remain critical
-
Competitive positioning: Firms with scalable platforms and strong pipelines are leading
Company Intelligence
The market is highly competitive, with a mix of large pharmaceutical companies and specialised biotechnology firms advancing innovation.
Leading companies are focusing on pipeline expansion, strategic partnerships, and manufacturing capabilities to strengthen their positions.
Competition is increasingly defined by:
-
Clinical pipeline strength
-
Technology platforms and innovation
-
Manufacturing scalability
-
Regulatory and commercial execution
This report analyses how competitive dynamics are evolving and where future opportunities will emerge.
Key Questions Answered
-
How is the Cell & Gene Therapy market evolving?
-
What are the key drivers and restraints shaping growth?
-
Which segments and regions will generate the most revenue?
-
How will reimbursement and pricing models evolve?
-
Who are the leading companies and what are their prospects?
Report Scope and Data Coverage
-
Global Cell & Gene Therapy market analysis
-
Revenue forecasts to 2036
-
Segment-level modelling across therapy type, indication, vector type, and end-user
-
Regional and national market forecasts
-
Competitive intelligence on leading companies
Segmentation Framework
By Therapy Type
-
Cell Therapy
– Stem Cell Therapy
– CAR-T Cell Therapy
– TCR-T Cell Therapy
– Others
-
Gene Therapy
– Gene Augmentation Therapy
– Gene Inhibition Therapy
– Gene Editing
– Others
By Indication
-
Oncology
-
Genetic Disorders
-
Cardiovascular Disorders
-
Neurological Disorders
-
Infectious Diseases
-
Ophthalmic Disorders
-
Others
By Vector Type
-
Viral Vectors
-
Retrovirus
-
Lentivirus
-
Adenovirus
-
AAV
-
Others
-
Non-viral Vectors
By End-user
-
Hospitals
-
Research Institutes
-
Pharmaceutical Companies
-
Others
Geographic Coverage
North America
Europe
-
Germany
-
UK
-
France
-
Italy
-
Spain
-
Russia
-
Rest of Europe
Asia Pacific
-
Japan
-
China
-
India
-
Australia
-
South Korea
-
Singapore
-
Rest of Asia Pacific
Latin America
-
Brazil
-
Mexico
-
Argentina
-
Rest of Latin America
Middle East & Africa
-
GCC
-
South Africa
-
Rest of Middle East & Africa
Company Intelligence Coverage
This report includes detailed profiles of leading companies such as:
-
Adaptimmune
-
ALLOGENE THERAPEUTICS
-
Atara Biotherapeutics, Inc.
-
Beam Therapeutics
-
BioMarin
-
Bristol-Myers Squibb Company
-
Catalent, Inc
-
CRISPR Therapeutics
-
Genetix Biotherapeutics Inc.
-
GenScript
-
Gilead Sciences, Inc.
-
Intellia Therapeutics, Inc.
-
Johnson & Johnson
-
Lonza
-
MeiraGTx Limited
-
Novartis AG
-
Sarepta Therapeutics, Inc.
-
Ultragenyx Pharmaceutical Inc.
-
Vertex Pharmaceuticals Incorporated
Each profile includes:
-
Business overview
-
Financial positioning
-
Product and technology capabilities
-
Strategic outlook
Bespoke Intelligence & Customisation
Visiongain provides tailored intelligence to support specific business needs, including custom forecasts, competitive benchmarking, and regulatory analysis.
Why This Market Intelligence Matters
-
The Cell & Gene Therapy market is entering a critical growth phase, driven by scientific breakthroughs, expanding clinical adoption, and evolving reimbursement models.
-
Organisations that understand these dynamics will be better positioned to capture opportunities, manage risk, and strengthen competitive positioning.
ページTOPに戻る
Table of Contents
1 Report Overview
1.1 Objectives of the Study
1.2 Introduction to Cell & Gene Therapy Market
1.3 What This Report Delivers
1.4 Why You Should Read This Report
1.5 Key Questions Answered by This Analytical Report
1.6 Who is This Report for?
1.7 Methodology
1.7.1 Market Definitions
1.7.2 Market Evaluation & Forecasting Methodology
1.7.3 Data Validation
1.7.3.1 Primary Research
1.7.3.2 Secondary Research
1.8 Frequently Asked Questions (FAQs)
1.9 Associated Visiongain Reports
1.10 About Visiongain
2 Executive Summary
3 Market Overview
3.1 Key Findings
3.2 Market Dynamics
3.3 Impact Analysis
3.3.1 Market Driving Factors
3.3.1.1 Rising Prevalence of Genetic Disorders Fueling Advanced Therapeutic Adoption
3.3.1.2 Growing Investment in Biotechnology Research Driving Pipeline Innovation Expansion.
3.3.1.3 Increasing Regulatory Approvals, Accelerating Commercialization of Novel Therapies.
3.3.2 Market Restraining Factors
3.3.2.1 High Treatment Costs Limit Patient Accessibility and Market Penetration.
3.3.2.2 Complex Manufacturing Processes Causing Supply Chain Bottlenecks Worldwide.
3.3.2.3 Stringent Regulatory Frameworks are Delaying Product Approvals and Market Entry
3.3.3 Market Opportunities
3.3.3.1 Expanding Healthcare Infrastructure Supporting Advanced Therapy Integration Globally
3.3.3.2 Emerging Collaborations Fostering Rapid Innovation in Personalized Medicine
3.3.3.3 Technological Advancements Enabling Scalable Production of Cell-based Therapies
3.4 U.S. Tariffs: What’s the Impact on Global Cell & Gene Therapy Market?
3.4.1 Overview
3.4.2 V-Shaped Recovery Scenario
3.4.2.1 Why V-Shaped Recovery?
3.4.2.2 Impact from Tariffs
3.4.2.3 Market Dynamics and Demand Recovery
3.4.2.4 Policy and Funding Support
3.4.2.5 Timeframe for Recovery
3.4.3 U-Shaped Recovery Scenario
3.4.3.1 Why U-Shaped Recovery?
3.4.3.2 Impact from Tariffs
3.4.3.3 Market Dynamics and Demand Recovery
3.4.3.4 Policy and Funding Support
3.4.3.5 Timeframe for Recovery
3.4.4 L Shaped Recovery Scenario
3.4.4.1 Why L-Shaped Recovery?
3.4.4.2 Impact from Tariffs
3.4.4.3 Market Dynamics and Demand Recovery
3.4.4.4 Policy and Funding Support
3.4.4.5 Timeframe for Recovery
3.4.5 What Strategic Considerations Should Clients Factor into Their Near-term (2026–2030) and Long-term (2031–2036) Planning?
3.4.6 Impact of U.S. and China Trade War on Cell & Gene Therapy Market
3.4.7 How Might the Most Impacted Countries Experience Positive and Negative Effects Resulting from These Policy Changes?
3.4.8 Global Market Tariff Sensitivity and Margin Pressure Analysis
3.5 Porter’s Five Forces Analysis
3.5.1 Bargaining Power of Suppliers
3.5.2 Bargaining Power of Buyers
3.5.3 Competitive Rivalry
3.5.4 Threat of Substitutes
3.5.5 Threat of New Entrants
3.6 PEST Analysis
4 Cell & Gene Therapy Market Analysis by Therapy Type
4.1 Key Findings
4.2 Therapy Type Segment: Market Attractiveness Index
4.3 Cell & Gene Therapy Market Size Estimation and Forecast by Therapy Type
4.4 Cell Therapy
4.4.1 Market Size by Region, 2026-2036 (US$ Billion)
4.4.2 Market Share by Region, 2026 & 2036 (%)
4.4.3 Stem Cell Therapy
4.4.3.1 Market Size by Region, 2026-2036 (US$ Billion)
4.4.3.2 Market Share by Region, 2026 & 2036 (%)
4.4.4 CAR-T Cell Therapy
4.4.4.1 Market Size by Region, 2026-2036 (US$ Billion)
4.4.4.2 Market Share by Region, 2026 & 2036 (%)
4.4.5 TCR-T Cell Therapy
4.4.5.1 Market Size by Region, 2026-2036 (US$ Billion)
4.4.5.2 Market Share by Region, 2026 & 2036 (%)
4.4.6 Others
4.4.6.1 Market Size by Region, 2026-2036 (US$ Billion)
4.4.6.2 Market Share by Region, 2026 & 2036 (%)
4.5 Gene Therapy
4.5.1 Market Size by Region, 2026-2036 (US$ Billion)
4.5.2 Market Share by Region, 2026 & 2036 (%)
4.5.3 Gene Augmentation Therapy
4.5.3.1 Market Size by Region, 2026-2036 (US$ Billion)
4.5.3.2 Market Share by Region, 2026 & 2036 (%)
4.5.4 Gene Inhibition Therapy
4.5.4.1 Market Size by Region, 2026-2036 (US$ Billion)
4.5.4.2 Market Share by Region, 2026 & 2036 (%)
4.5.5 Gene Editing
4.5.5.1 Market Size by Region, 2026-2036 (US$ Billion)
4.5.5.2 Market Share by Region, 2026 & 2036 (%)
4.5.6 Others
4.5.6.1 Market Size by Region, 2026-2036 (US$ Billion)
4.5.6.2 Market Share by Region, 2026 & 2036 (%)
5 Cell & Gene Therapy Market Analysis by Indication
5.1 Key Findings
5.2 Therapy Type Segment: Market Attractiveness Index
5.3 Cell & Gene Therapy Market Size Estimation and Forecast by Indication
5.4 Oncology
5.4.1 Market Size by Region, 2026-2036 (US$ Billion)
5.4.2 Market Share by Region, 2026 & 2036 (%)
5.5 Genetic Disorders
5.5.1 Market Size by Region, 2026-2036 (US$ Billion)
5.5.2 Market Share by Region, 2026 & 2036 (%)
5.6 Cardiovascular Disorders
5.6.1 Market Size by Region, 2026-2036 (US$ Billion)
5.6.2 Market Share by Region, 2026 & 2036 (%)
5.7 Neurological Disorders
5.7.1 Market Size by Region, 2026-2036 (US$ Billion)
5.7.2 Market Share by Region, 2026 & 2036 (%)
5.8 Infectious Diseases
5.8.1 Market Size by Region, 2026-2036 (US$ Billion)
5.8.2 Market Share by Region, 2026 & 2036 (%)
5.9 Ophthalmic Disorders
5.9.1 Market Size by Region, 2026-2036 (US$ Billion)
5.9.2 Market Share by Region, 2026 & 2036 (%)
5.10 Others
5.10.1 Market Size by Region, 2026-2036 (US$ Billion)
5.10.2 Market Share by Region, 2026 & 2036 (%)
6 Cell & Gene Therapy Market Analysis by Vector Type
6.1 Key Findings
6.2 Vector Type Segment: Market Attractiveness Index
6.3 Cell & Gene Therapy Market Size Estimation and Forecast by Vector Type
6.4 Viral Vectors
6.4.1 Market Size by Region, 2026-2036 (US$ Billion)
6.4.2 Market Share by Region, 2026 & 2036 (%)
6.4.3 Retrovirus
6.4.3.1 Market Size by Region, 2026-2036 (US$ Billion)
6.4.3.2 Market Share by Region, 2026 & 2036 (%)
6.4.4 Lentivirus
6.4.4.1 Market Size by Region, 2026-2036 (US$ Billion)
6.4.4.2 Market Share by Region, 2026 & 2036 (%)
6.4.5 Adenovirus
6.4.5.1 Market Size by Region, 2026-2036 (US$ Billion)
6.4.5.2 Market Share by Region, 2026 & 2036 (%)
6.4.6 AAV (Adeno-associated virus)
6.4.6.1 Market Size by Region, 2026-2036 (US$ Billion)
6.4.6.2 Market Share by Region, 2026 & 2036 (%)
6.4.7 Others
6.4.7.1 Market Size by Region, 2026-2036 (US$ Billion)
6.4.7.2 Market Share by Region, 2026 & 2036 (%)
6.5 Non-viral Vectors
6.5.1 Market Size by Region, 2026-2036 (US$ Billion)
6.5.2 Market Share by Region, 2026 & 2036 (%)
7 Cell & Gene Therapy Market Analysis by End User
7.1 Key Findings
7.2 End-user Segment: Market Attractiveness Index
7.3 Cell & Gene Therapy Market Size Estimation and Forecast by End-user
7.4 Hospitals
7.4.1 Market Size by Region, 2026-2036 (US$ Billion)
7.4.2 Market Share by Region, 2026 & 2036 (%)
7.5 Research Institutes
7.5.1 Market Size by Region, 2026-2036 (US$ Billion)
7.5.2 Market Share by Region, 2026 & 2036 (%)
7.6 Pharmaceutical Companies
7.6.1 Market Size by Region, 2026-2036 (US$ Billion)
7.6.2 Market Share by Region, 2026 & 2036 (%)
7.7 Others
7.7.1 Market Size by Region, 2026-2036 (US$ Billion)
7.7.2 Market Share by Region, 2026 & 2036 (%)
8 Cell & Gene Therapy Market Analysis by Region
8.1 Key Findings
8.2 Regional Market Size Estimation and Forecast
9 North America Cell & Gene Therapy Market Analysis
9.1 Key Findings
9.2 North America Cell & Gene Therapy Market Attractiveness Index
9.3 North America Cell & Gene Therapy Market by Country, 2026, 2031 & 2036 (US$ Billion)
9.4 North America Cell & Gene Therapy Market Size Estimation and Forecast by Country
9.5 North America Cell & Gene Therapy Market Size Estimation and Forecast by Therapy Type
9.6 North America Cell & Gene Therapy Market Size Estimation and Forecast by Indication
9.7 North America Cell & Gene Therapy Market Size Estimation and Forecast by Vector Type
9.8 North America Cell & Gene Therapy Market Size Estimation and Forecast by End-user
9.9 U.S. Cell & Gene Therapy Market Analysis
9.10 Canada Cell & Gene Therapy Market Analysis
10 Europe Cell & Gene Therapy Market Analysis
10.1 Key Findings
10.2 Europe Cell & Gene Therapy Market Attractiveness Index
10.3 Europe Cell & Gene Therapy Market by Country, 2026, 2031 & 2036 (US$ Billion)
10.4 Europe Cell & Gene Therapy Market Size Estimation and Forecast by Country
10.5 Europe Cell & Gene Therapy Market Size Estimation and Forecast by Therapy Type
10.6 Europe Cell & Gene Therapy Market Size Estimation and Forecast by Indication
10.7 Europe Cell & Gene Therapy Market Size Estimation and Forecast by Vector Type
10.8 Europe Cell & Gene Therapy Market Size Estimation and Forecast by End-user
10.9 Germany Cell & Gene Therapy Market Analysis
10.10 France Cell & Gene Therapy Market Analysis
10.11 UK Cell & Gene Therapy Market Analysis
10.12 Italy Cell & Gene Therapy Market Analysis
10.13 Spain Cell & Gene Therapy Market Analysis
10.14 Russia Cell & Gene Therapy Market Analysis
10.15 Rest of Europe Cell & Gene Therapy Market Analysis
11 Asia Pacific Cell & Gene Therapy Market Analysis
11.1 Key Findings
11.2 Asia Pacific Cell & Gene Therapy Market Attractiveness Index
11.3 Asia Pacific Cell & Gene Therapy Market by Country, 2026, 2031 & 2036 (US$ Billion)
11.4 Asia-Pacific Cell & Gene Therapy Market Size Estimation and Forecast by Country
11.5 Asia Pacific Cell & Gene Therapy Market Size Estimation and Forecast by Therapy Type
11.6 Asia Pacific Cell & Gene Therapy Market Size Estimation and Forecast by Indication
11.7 Asia Pacific Cell & Gene Therapy Market Size Estimation and Forecast by Vector Type
11.8 Asia Pacific Cell & Gene Therapy Market Size Estimation and Forecast by End-user
11.9 Japan Cell & Gene Therapy Market Analysis
11.10 China Cell & Gene Therapy Market Analysis
11.11 India Cell & Gene Therapy Market Analysis
11.12 Australia Cell & Gene Therapy Market Analysis
11.13 South Korea Cell & Gene Therapy Market Analysis
11.14 Singapore Cell & Gene Therapy Market Analysis
11.15 Rest of Asia Pacific Cell & Gene Therapy Market Analysis
12 Latin America Cell & Gene Therapy Market Analysis
12.1 Key Findings
12.2 Latin America Cell & Gene Therapy Market Attractiveness Index
12.3 Latin America Cell & Gene Therapy Market by Country, 2026, 2031 & 2036 (US$ Billion)
12.4 Latin America Cell & Gene Therapy Market Size Estimation and Forecast by Country
12.5 Latin America Cell & Gene Therapy Market Size Estimation and Forecast by Therapy Type
12.6 Latin America Cell & Gene Therapy Market Size Estimation and Forecast by Indication
12.7 Latin America Cell & Gene Therapy Market Size Estimation and Forecast by Vector Type
12.8 Latin America Cell & Gene Therapy Market Size Estimation and Forecast by End-user
12.9 Brazil Cell & Gene Therapy Market Analysis
12.10 Mexico Cell & Gene Therapy Market Analysis
12.11 Argentina Cell & Gene Therapy Market Analysis
12.12 Rest of Latin America Cell & Gene Therapy Market Analysis
13 MEA Cell & Gene Therapy Market Analysis
13.1 Key Findings
13.2 MEA Cell & Gene Therapy Market Attractiveness Index
13.3 MEA Cell & Gene Therapy Market by Country, 2026, 2031 & 2036 (US$ Billion)
13.4 MEA Cell & Gene Therapy Market Size Estimation and Forecast by Country
13.5 MEA Cell & Gene Therapy Market Size Estimation and Forecast by Therapy Type
13.6 MEA Cell & Gene Therapy Market Size Estimation and Forecast by Indication
13.7 MEA Cell & Gene Therapy Market Size Estimation and Forecast by Vector Type
13.8 MEA Cell & Gene Therapy Market Size Estimation and Forecast by End-user
13.9 GCC Cell & Gene Therapy Market Analysis
13.10 South Africa Cell & Gene Therapy Market Analysis
13.11 Rest of the MEA Cell & Gene Therapy Market Analysis
14 Company Profiles
14.1 Competitive Landscape, 2026
14.2 Strategic Outlook
14.3 Adaptimmune
14.3.1 Company Snapshot
14.3.2 Company Overview
14.3.3 Financial Analysis
14.3.3.1 Net Revenue, 2021-2024
14.3.3.2 R&D, 2021-2024
14.3.4 Product Benchmarking
14.3.5 SWOT Analysis
14.3.6 Strategic Outlook
14.4 ALLOGENE THERAPEUTICS
14.4.1 Company Snapshot
14.4.2 Company Overview
14.4.3 Financial Analysis
14.4.3.1 Net Revenue, 2021-2024
14.4.3.2 R&D, 2021-2024
14.4.4 Product Benchmarking
14.4.5 SWOT Analysis
14.4.6 Strategic Outlook
14.5 Atara Biotherapeutics, Inc.
14.5.1 Company Snapshot
14.5.2 Company Overview
14.5.3 Financial Analysis
14.5.3.1 Net Revenue, 2021-2024
14.5.3.2 R&D, 2021-2024
14.5.4 Product Benchmarking
14.5.5 SWOT Analysis
14.5.6 Strategic Outlook
14.6 Beam Therapeutics
14.6.1 Company Snapshot
14.6.2 Company Overview
14.6.3 Financial Analysis
14.6.3.1 Net Revenue, 2021-2024
14.6.3.2 R&D, 2021-2024
14.6.4 Product Benchmarking
14.6.5 SWOT Analysis
14.6.6 Strategic Outlook
14.7 BioMarin
14.7.1 Company Snapshot
14.7.2 Company Overview
14.7.3 Financial Analysis
14.7.3.1 Net Revenue, 2021-2025
14.7.3.2 R&D, 2021-2025
14.7.3.3 Regional Market Shares, 2025
14.7.4 Product Benchmarking
14.7.5 SWOT Analysis
14.7.6 Strategic Outlook
14.8 Bristol-Myers Squibb Company
14.8.1 Company Snapshot
14.8.2 Company Overview
14.8.3 Financial Analysis
14.8.3.1 Net Revenue, 2021-2025
14.8.3.2 R&D, 2021-2025
14.8.3.3 Regional Market Shares, 2024
14.8.3.4 Business Segment Market Shares, 2024
14.8.4 Product Benchmarking
14.8.5 SWOT Analysis
14.8.6 Strategic Outlook
14.9 Catalent, Inc
14.9.1 Company Snapshot
14.9.2 Company Overview
14.9.3 Financial Analysis
14.9.3.1 Net Revenue, 2021-2024
14.9.3.2 Regional Market Shares, 2024
14.9.3.3 Business Segment Market Shares, 2024
14.9.4 Product Benchmarking
14.9.5 SWOT Analysis
14.9.6 Strategic Outlook
14.10 CRISPR Therapeutics
14.10.1 Company Snapshot
14.10.2 Company Overview
14.10.3 Financial Analysis
14.10.3.1 Net Revenue, 2021-2025
14.10.3.2 R&D, 2021-2024
14.10.4 Product Benchmarking
14.10.5 SWOT Analysis
14.10.6 Strategic Outlook
14.11 Genetix Biotherapeutics Inc.
14.11.1 Company Snapshot
14.11.2 Company Overview
14.11.3 Product Benchmarking
14.11.4 SWOT Analysis
14.12 GenScript
14.12.1 Company Snapshot
14.12.2 Company Overview
14.12.3 Financial Analysis
14.12.3.1 Net Revenue, 2021-2025
14.12.3.2 Regional Market Shares, 2024
14.12.3.3 Business Segment Market Shares, 2025
14.12.4 Product Benchmarking
14.12.5 SWOT Analysis
14.12.6 Strategic Outlook
14.13 Gilead Sciences, Inc.
14.13.1 Company Snapshot
14.13.2 Company Overview
14.13.3 Financial Analysis
14.13.3.1 Net Revenue, 2021-2025
14.13.3.2 R&D, 2021-2025
14.13.3.3 Regional Market Shares, 2025
14.13.3.4 Business Segment Market Shares, 2025
14.13.4 Product Benchmarking
14.13.5 SWOT Analysis
14.13.6 Strategic Outlook
14.14 Intellia Therapeutics, Inc.
14.14.1 Company Snapshot
14.14.2 Company Overview
14.14.3 Financial Analysis
14.14.3.1 Net Revenue, 2021-2024
14.14.3.2 R&D, 2021-2024
14.14.4 Product Benchmarking
14.14.5 SWOT Analysis
14.14.6 Strategic Outlook
14.15 Johnson & Johnson
14.15.1 Company Snapshot
14.15.2 Company Overview
14.15.3 Financial Analysis
14.15.3.1 Net Revenue, 2021-2025
14.15.3.2 R&D, 2021-2025
14.15.3.3 Regional Market Shares, 2025
14.15.3.4 Business Segment Market Shares, 2025
14.15.4 Product Benchmarking
14.15.5 SWOT Analysis
14.15.6 Strategic Outlook
14.16 Lonza
14.16.1 Company Snapshot
14.16.2 Company Overview
14.16.3 Financial Analysis
14.16.3.1 Net Revenue, 2021-2024
14.16.3.2 R&D, 2021-2024
14.16.3.3 Regional Market Shares, 2024
14.16.3.4 Business Segment Market Shares, 2024
14.16.4 Product Benchmarking
14.16.5 SWOT Analysis
14.16.6 Strategic Outlook
14.17 MeiraGTx Limited
14.17.1 Company Snapshot
14.17.2 Company Overview
14.17.3 Financial Analysis
14.17.3.1 Net Revenue, 2021-2024
14.17.3.2 R&D, 2021-2024
14.17.4 Product Benchmarking
14.17.5 SWOT Analysis
14.17.6 Strategic Outlook
14.18 Novartis AG
14.18.1 Company Snapshot
14.18.2 Company Overview
14.18.3 Financial Analysis
14.18.3.1 Net Revenue, 2021-2025
14.18.3.2 R&D, 2021-2025
14.18.3.3 Regional Market Shares, 2025
14.18.3.4 Business Segment Market Shares, 2025
14.18.4 Product Benchmarking
14.18.5 SWOT Analysis
14.18.6 Strategic Outlook
14.19 Sarepta Therapeutics, Inc.
14.19.1 Company Snapshot
14.19.2 Company Overview
14.19.3 Financial Analysis
14.19.3.1 Net Revenue, 2021-2024
14.19.3.2 R&D, 2021-2024
14.19.3.3 Business Segment Market Shares, 2024
14.19.4 Product Benchmarking
14.19.5 SWOT Analysis
14.19.6 Strategic Outlook
14.20 Ultragenyx Pharmaceutical Inc.
14.20.1 Company Snapshot
14.20.2 Company Overview
14.20.3 Financial Analysis
14.20.3.1 Net Revenue, 2021-2025
14.20.3.2 R&D, 2021-2025
14.20.3.3 Regional Market Shares, 2025
14.20.4 Product Benchmarking
14.20.5 SWOT Analysis
14.20.6 Strategic Outlook
14.21 Vertex Pharmaceuticals Incorporated
14.21.1 Company Snapshot
14.21.2 Company Overview
14.21.3 Financial Analysis
14.21.3.1 Net Revenue, 2021-2025
14.21.3.2 R&D, 2021-2025
14.21.3.3 Regional Market Shares, 2024
14.21.4 Product Benchmarking
14.21.5 SWOT Analysis
14.21.6 Strategic Outlook
15 Conclusion and Recommendations
15.1 Concluding Remarks from Visiongain
15.2 Recommendations for Market Players
ページTOPに戻る
List of Tables/Graphs
List of Tables
Table 1 Cell & Gene Therapy Market Snapshot, 2026 & 2036 (US$ Billion, CAGR %)
Table 2 Cell & Gene Therapy Market: International Trade Tariff Impact Recovery Scenarios Snapshot
Table 3 Cell & Gene Therapy Market Forecast by Region 2026-2036 (US$ Billion, AGR%, CAGR%), Tariff Impact: V- Shaped Recovery Scenario
Table 4 Cell & Gene Therapy Market Forecast by Region 2026-2036 (US$ Billion, AGR%, CAGR%), Tariff Impact: U- Shaped Recovery Scenario
Table 5 Cell & Gene Therapy Market Forecast by Region 2026-2036 (US$ Billion, AGR%, CAGR%), Tariff Impact: L- Shaped Recovery Scenario
Table 6 Cell & Gene Therapy Market Forecast by Therapy Type, 2026-2036 (US$ Billion, AGR%, CAGR%)
Table 7 Cell & Gene Therapy Market Forecast by Cell Therapy, 2026-2036 (US$ Billion, AGR%, CAGR%)
Table 8 Cell Therapy Segment Market Forecast by Region, 2026-2036 (US$ Billion, AGR%, CAGR%)
Table 9 Stem Cell Therapy Segment Market Forecast by Region, 2026-2036 (US$ Billion, AGR%, CAGR%)
Table 10 CAR-T Cell Therapy Segment Market Forecast by Region, 2026-2036 (US$ Billion, AGR%, CAGR%)
Table 11 TCR-T Cell Therapy Segment Market Forecast by Region, 2026-2036 (US$ Billion, AGR%, CAGR%)
Table 12 Others Segment Market Forecast by Region, 2026-2036 (US$ Billion, AGR%, CAGR%)
Table 13 Cell & Gene Therapy Market Forecast by Gene Therapy, 2026-2036 (US$ Billion, AGR%, CAGR%)
Table 14 Gene Therapy Segment Market Forecast by Region, 2026-2036 (US$ Billion, AGR%, CAGR%)
Table 15 Gene Augmentation Therapy Segment Market Forecast by Region, 2026-2036 (US$ Billion, AGR%, CAGR%)
Table 16 Gene Inhibition Therapy Segment Market Forecast by Region, 2026-2036 (US$ Billion, AGR%, CAGR%)
Table 17 Gene Editing Segment Market Forecast by Region, 2026-2036 (US$ Billion, AGR%, CAGR%)
Table 18 Others Segment Market Forecast by Region, 2026-2036 (US$ Billion, AGR%, CAGR%)
Table 19 Cell & Gene Therapy Market Forecast by Indication, 2026-2036 (US$ Billion, AGR%, CAGR%)
Table 20 Oncology Segment Market Forecast by Region, 2026-2036 (US$ Billion, AGR%, CAGR%)
Table 21 Genetic Disorders Segment Market Forecast by Region, 2026-2036 (US$ Billion, AGR%, CAGR%)
Table 22 Cardiovascular Disorders Segment Market Forecast by Region, 2026-2036 (US$ Billion, AGR%, CAGR%)
Table 23 Neurological Disorders Segment Market Forecast by Region, 2026-2036 (US$ Billion, AGR%, CAGR%)
Table 24 Infectious Diseases Segment Market Forecast by Region, 2026-2036 (US$ Billion, AGR%, CAGR%)
Table 25 Ophthalmic Disorders Segment Market Forecast by Region, 2026-2036 (US$ Billion, AGR%, CAGR%)
Table 26 Others Segment Market Forecast by Region, 2026-2036 (US$ Billion, AGR%, CAGR%)
Table 27 Cell & Gene Therapy Market Forecast by Vector Type, 2026-2036 (US$ Billion, AGR%, CAGR%)
Table 28 Cell & Gene Therapy Market Forecast by Viral Vectors, 2026-2036 (US$ Billion, AGR%, CAGR%)
Table 29 Viral Vectors Segment Market Forecast by Region, 2026-2036 (US$ Billion, AGR%, CAGR%)
Table 30 Retrovirus Segment Market Forecast by Region, 2026-2036 (US$ Billion, AGR%, CAGR%)
Table 31 Lentivirus Segment Market Forecast by Region, 2026-2036 (US$ Billion, AGR%, CAGR%)
Table 32 Adenovirus Segment Market Forecast by Region, 2026-2036 (US$ Billion, AGR%, CAGR%)
Table 33 AAV Segment Market Forecast by Region, 2026-2036 (US$ Billion, AGR%, CAGR%)
Table 34 Others Segment Market Forecast by Region, 2026-2036 (US$ Billion, AGR%, CAGR%)
Table 35 Non-viral vectors Segment Market Forecast by Region, 2026-2036 (US$ Billion, AGR%, CAGR%)
Table 36 Cell & Gene Therapy Market Forecast by End-user, 2026-2036 (US$ Billion, AGR%, CAGR%)
Table 37 Hospitals Segment Market Forecast by Region, 2026-2036 (US$ Billion, AGR%, CAGR%)
Table 38 Research Institutes Segment Market Forecast by Region, 2026-2036 (US$ Billion, AGR%, CAGR%)
Table 39 Pharmaceutical Companies Segment Market Forecast by Region, 2026-2036 (US$ Billion, AGR%, CAGR%)
Table 40 Others Segment Market Forecast by Region, 2026-2036 (US$ Billion, AGR%, CAGR%)
Table 41 Cell & Gene Therapy Market Forecast by Region, 2026-2036 (US$ Billion, AGR%, CAGR%)
Table 42 North America Cell & Gene Therapy Market Forecast by Country, 2026-2036 (US$ Billion, AGR%, CAGR%)
Table 43 North America Cell & Gene Therapy Market Forecast by Therapy Type, 2026-2036 (US$ Billion, AGR%, CAGR%)
Table 44 North America Cell & Gene Therapy Market Forecast by Indication, 2026-2036 (US$ Billion, AGR%, CAGR%)
Table 45 North America Cell & Gene Therapy Market Forecast by Vector Type, 2026-2036 (US$ Billion, AGR%, CAGR%)
Table 46 North America Cell & Gene Therapy Market Forecast by End-user, 2026-2036 (US$ Billion, AGR%, CAGR%)
Table 47 U.S. Cell & Gene Therapy Market Forecast, 2026-2036 (US$ Billion, AGR%, CAGR%)
Table 48 Canada Cell & Gene Therapy Market Forecast, 2026-2036 (US$ Billion, AGR%, CAGR%)
Table 49 Europe Cell & Gene Therapy Market Forecast by Country, 2026-2036 (US$ Billion, AGR%, CAGR%)
Table 50 Europe Cell & Gene Therapy Market Forecast by Therapy Type, 2026-2036 (US$ Billion, AGR%, CAGR%)
Table 51 Europe Cell & Gene Therapy Market Forecast by Indication, 2026-2036 (US$ Billion, AGR%, CAGR%)
Table 52 Europe Cell & Gene Therapy Market Forecast by Vector Type, 2026-2036 (US$ Billion, AGR%, CAGR%)
Table 53 Europe Cell & Gene Therapy Market Forecast by End-user, 2026-2036 (US$ Billion, AGR%, CAGR%)
Table 54 Germany Cell & Gene Therapy Market Forecast, 2026-2036 (US$ Billion, AGR%, CAGR%)
Table 55 France Cell & Gene Therapy Market Forecast, 2026-2036 (US$ Billion, AGR%, CAGR%)
Table 56 UK Cell & Gene Therapy Market Forecast, 2026-2036 (US$ Billion, AGR%, CAGR%)
Table 57 Italy Cell & Gene Therapy Market Forecast, 2026-2036 (US$ Billion, AGR%, CAGR%)
Table 58 Spain Cell & Gene Therapy Market Forecast, 2026-2036 (US$ Million, AGR%, CAGR%)
Table 59 Russia Cell & Gene Therapy Market Forecast, 2026-2036 (US$ Billion, AGR%, CAGR%)
Table 60 Rest of Europe Cell & Gene Therapy Market Forecast, 2026-2036 (US$ Billion, AGR%, CAGR%)
Table 61 Asia-Pacific Cell & Gene Therapy Market Forecast by Country, 2026-2036 (US$ Billion, AGR%, CAGR%)
Table 62 Asia Pacific Cell & Gene Therapy Market Forecast by Therapy Type, 2026-2036 (US$ Billion, AGR%, CAGR%)
Table 63 Asia Pacific Cell & Gene Therapy Market Forecast by Indication, 2026-2036 (US$ Billion, AGR%, CAGR%)
Table 64 Asia Pacific Cell & Gene Therapy Market Forecast by Vector Type, 2026-2036 (US$ Billion, AGR%, CAGR%)
Table 65 Asia Pacific Cell & Gene Therapy Market Forecast by End-user, 2026-2036 (US$ Billion, AGR%, CAGR%)
Table 66 Japan Cell & Gene Therapy Market Forecast, 2026-2036 (US$ Billion, AGR%, CAGR%)
Table 67 China Cell & Gene Therapy Market Forecast, 2026-2036 (US$ Billion, AGR%, CAGR%)
Table 68 India Cell & Gene Therapy Market Forecast, 2026-2036 (US$ Billion, AGR%, CAGR%)
Table 69 Australia Cell & Gene Therapy Market Forecast, 2026-2036 (US$ Billion, AGR%, CAGR%)
Table 70 South Korea Cell & Gene Therapy Market Forecast, 2026-2036 (US$ Billion, AGR%, CAGR%)
Table 71 Singapore Cell & Gene Therapy Market Forecast, 2026-2036 (US$ Billion, AGR%, CAGR%)
Table 72 Rest of Asia Pacific Cell & Gene Therapy Market Forecast, 2026-2036 (US$ Billion, AGR%, CAGR%)
Table 73 Latin America Cell & Gene Therapy Market Forecast by Country, 2026-2036 (US$ Billion, AGR%, CAGR%)
Table 74 Latin America Cell & Gene Therapy Market Forecast by Therapy Type, 2026-2036 (US$ Billion, AGR%, CAGR%)
Table 75 Latin America Cell & Gene Therapy Market Forecast by Indication, 2026-2036 (US$ Billion, AGR%, CAGR%)
Table 76 Latin America Cell & Gene Therapy Market Forecast by Vector Type, 2026-2036 (US$ Billion, AGR%, CAGR%)
Table 77 Latin America Cell & Gene Therapy Market Forecast by End-user, 2026-2036 (US$ Billion, AGR%, CAGR%)
Table 78 Brazil Cell & Gene Therapy Market Forecast, 2026-2036 (US$ Billion, AGR%, CAGR%)
Table 79 Mexico Cell & Gene Therapy Market Forecast, 2026-2036 (US$ Billion, AGR%, CAGR%)
Table 80 Argentina Cell & Gene Therapy Market Forecast, 2026-2036 (US$ Billion, AGR%, CAGR%)
Table 81 Rest of Latin America Cell & Gene Therapy Market Forecast, 2026-2036 (US$ Billion, AGR%, CAGR%)
Table 82 MEA Cell & Gene Therapy Market Forecast by Country, 2026-2036 (US$ Billion, AGR%, CAGR%)
Table 83 MEA Cell & Gene Therapy Market Forecast by Therapy Type, 2026-2036 (US$ Billion, AGR%, CAGR%)
Table 84 MEA Cell & Gene Therapy Market Forecast by Indication, 2026-2036 (US$ Billion, AGR%, CAGR%)
Table 85 MEA Cell & Gene Therapy Market Forecast by Vector Type, 2026-2036 (US$ Billion, AGR%, CAGR%)
Table 86 MEA Cell & Gene Therapy Market Forecast by End-user, 2026-2036 (US$ Billion, AGR%, CAGR%)
Table 87 GCC Cell & Gene Therapy Market Forecast, 2026-2036 (US$ Billion, AGR%, CAGR%)
Table 88 South Africa Cell & Gene Therapy Market Forecast, 2026-2036 (US$ Billion, AGR%, CAGR%)
Table 89 Rest of the MEA Cell & Gene Therapy Market Forecast, 2026-2036 (US$ Billion, AGR%, CAGR%)
Table 90 Strategic Outlook
Table 91 Adaptimmune: Key Details, (CEO, HQ, Revenue, Founded, No. of Employees, Company Type, Website, Business Segment)
Table 92 Adaptimmune: Product Benchmarking
Table 93 Adaptimmune: SWOT Analysis
Table 94 Adaptimmune: Strategic Outlook
Table 95 ALLOGENE THERAPEUTICS: Key Details, (CEO, HQ, Revenue, Founded, No. of Employees, Company Type, Website, Business Segment)
Table 96 ALLOGENE THERAPEUTICS: Product Benchmarking
Table 97 ALLOGENE THERAPEUTICS: SWOT Analysis
Table 98 ALLOGENE THERAPEUTICS: Strategic Outlook
Table 99 Atara Biotherapeutics, Inc.: Key Details, (CEO, HQ, Revenue, Founded, No. of Employees, Company Type, Website, Business Segment)
Table 100 Atara Biotherapeutics: Product Benchmarking
Table 101 Atara Biotherapeutics: SWOT Analysis
Table 102 Atara Biotherapeutics: Strategic Outlook
Table 103 Beam Therapeutics: Key Details, (CEO, HQ, Revenue, Founded, No. of Employees, Company Type, Website, Business Segment)
Table 104 Beam Therapeutics: Product Benchmarking
Table 105 Beam Therapeutics: SWOT Analysis
Table 106 Beam Therapeutics: Strategic Outlook
Table 107 BioMarin: Key Details, (CEO, HQ, Revenue, Founded, No. of Employees, Company Type, Website, Business Segment)
Table 108 BioMarin: Product Benchmarking
Table 109 BioMarin: SWOT Analysis
Table 110 BioMarin: Strategic Outlook
Table 111 Bristol-Myers Squibb Company: Key Details, (CEO, HQ, Revenue, Founded, No. of Employees, Company Type, Website, Business Segment)
Table 112 Bristol-Myers Squibb Company: Product Benchmarking
Table 113 Bristol-Myers Squibb: SWOT Analysis
Table 114 Bristol-Myers Squibb: Strategic Outlook
Table 115 Catalent, Inc: Key Details, (CEO, HQ, Revenue, Founded, No. of Employees, Company Type, Website, Business Segment)
Table 116 Catalent, Inc: Product Benchmarking
Table 117 Catalent, Inc: SWOT Analysis
Table 118 Catalent, Inc: Strategic Outlook
Table 119 CRISPR Therapeutics: Key Details, (CEO, HQ, Revenue, Founded, No. of Employees, Company Type, Website, Business Segment)
Table 120 CRISPR Therapeutics: Product Benchmarking
Table 121 CRISPR Therapeutics: SWOT Analysis
Table 122 CRISPR Therapeutics: Strategic Outlook
Table 123 Genetix Biotherapeutics Inc.: Key Details, (CEO, HQ, Revenue, Founded, No. of Employees, Company Type, Website, Business Segment)
Table 124 Genetix Biotherapeutics Inc.: Product Benchmarking
Table 125 Genetix Biotherapeutics Inc.: SWOT Analysis
Table 126 GenScript: Key Details, (CEO, HQ, Revenue, Founded, No. of Employees, Company Type, Website, Business Segment)
Table 127 GenScript: Product Benchmarking
Table 128 GenScript: SWOT Analysis
Table 129 Genetix Biotherapeutics Inc.: Strategic Outlook
Table 130 Gilead Sciences, Inc.: Key Details, (CEO, HQ, Revenue, Founded, No. of Employees, Company Type, Website, Business Segment)
Table 131 Gilead Sciences, Inc.: Product Benchmarking
Table 132 Gilead Sciences, Inc.: SWOT Analysis
Table 133 Gilead Sciences, Inc.: Strategic Outlook
Table 134 Intellia Therapeutics, Inc.: Key Details, (CEO, HQ, Revenue, Founded, No. of Employees, Company Type, Website, Business Segment)
Table 135 Intellia Therapeutics, Inc.: Product Benchmarking
Table 136 Intellia Therapeutics, Inc.: SWOT Analysis
Table 137 Intellia Therapeutics, Inc.: Strategic Outlook
Table 138 Johnson & Johnson: Key Details, (CEO, HQ, Revenue, Founded, No. of Employees, Company Type, Website, Business Segment)
Table 139 Johnson & Johnson: Product Benchmarking
Table 140 Johnson & Johnson: SWOT Analysis
Table 141 Johnson & Johnson: Strategic Outlook
Table 142 Lonza: Key Details, (CEO, HQ, Revenue, Founded, No. of Employees, Company Type, Website, Business Segment)
Table 143 Lonza: Product Benchmarking
Table 144 Lonza: SWOT Analysis
Table 145 Lonza: Strategic Outlook
Table 146 MeiraGTx Limited: Key Details, (CEO, HQ, Revenue, Founded, No. of Employees, Company Type, Website, Business Segment)
Table 147 MeiraGTx Limited: Product Benchmarking
Table 148 MeiraGTx Limited: SWOT Analysis
Table 149 MeiraGTx Limited: Strategic Outlook
Table 150 Novartis AG: Key Details, (CEO, HQ, Revenue, Founded, No. of Employees, Company Type, Website, Business Segment)
Table 151 Novartis AG: Product Benchmarking
Table 152 Novartis AG: SWOT Analysis
Table 153 Novartis AG: Strategic Outlook
Table 154 Sarepta Therapeutics, Inc.: Key Details, (CEO, HQ, Revenue, Founded, No. of Employees, Company Type, Website, Business Segment)
Table 155 Sarepta Therapeutics, Inc.: Product Benchmarking
Table 156 Sarepta Therapeutics, Inc.: SWOT Analysis
Table 157 Sarepta Therapeutics, Inc.: Strategic Outlook
Table 158 Ultragenyx Pharmaceutical Inc.: Key Details, (CEO, HQ, Revenue, Founded, No. of Employees, Company Type, Website, Business Segment)
Table 159 Ultragenyx Pharmaceutical Inc.: Product Benchmarking
Table 160 Ultragenyx Pharmaceutical Inc.: SWOT Analysis
Table 161 Ultragenyx Pharmaceutical Inc.: Strategic Outlook
Table 162 Vertex Pharmaceuticals Incorporated: Key Details, (CEO, HQ, Revenue, Founded, No. of Employees, Company Type, Website, Business Segment)
Table 163 Vertex Pharmaceuticals Incorporated: Product Benchmarking
Table 164 Vertex Pharmaceuticals Incorporated: SWOT Analysis
Table 165 Vertex Pharmaceuticals Incorporated: Strategic Outlook
List of Figures
Figure 1 Cell & Gene Therapy Market Segmentation
Figure 2 Cell & Gene Therapy Market by Therapy Type: Market Attractiveness Index
Figure 3 Cell & Gene Therapy Market by Indication: Market Attractiveness Index
Figure 4 Cell & Gene Therapy Market by Vector Type: Market Attractiveness Index
Figure 5 Cell & Gene Therapy Market by End User: Market Attractiveness Index
Figure 6 Cell & Gene Therapy Market Attractiveness Index by Region
Figure 7 Cell & Gene Therapy Market: Market Dynamics
Figure 8 Cell & Gene Therapy Market: Impact Analysis
Figure 9 Cell & Gene Therapy Market by Region, 2026-2036 (US$ Billion, AGR %), Tariff Impact: V-Shaped Recovery Scenario
Figure 10 Cell & Gene Therapy Market by Region, 2026-2036 (US$ Billion, AGR %), Tariff Impact: U-Shaped Recovery Scenario
Figure 11 Cell & Gene Therapy Market by Region, 2026-2036 (US$ Billion, AGR %), Tariff Impact: L-Shaped Recovery Scenario
Figure 12 Short Term & Long Term Planning
Figure 13 Impact of U.S. and China Trade War
Figure 14 Most Impacted Countries
Figure 15 Global Market Tariff Sensitivity and Margin Pressure Analysis
Figure 16 Cell & Gene Therapy Market: Porter’s Five Forces Analysis
Figure 17 Cell & Gene Therapy Market: PEST Analysis
Figure 18 Cell & Gene Therapy Market by Therapy Type: Market Attractiveness Index
Figure 19 Cell & Gene Therapy Market Forecast by Therapy Type, 2026-2036 (US$ Billion, AGR %)
Figure 20 Cell & Gene Therapy Market Share Forecast by Therapy Type, 2026, 2031, 2036 (%)
Figure 21 Cell Therapy Segment Market Forecast by Region, 2026-2036 (US$ Billion, AGR %)
Figure 22 Cell Therapy Segment Market Share Forecast by Region, 2026 & 2036 (%)
Figure 23 Stem Cell Therapy Segment Market Forecast by Region, 2026-2036 (US$ Billion, AGR %)
Figure 24 Stem Cell Therapy Segment Market Share Forecast by Region, 2026 & 2036 (%)
Figure 25 CAR-T Cell Therapy Segment Market Forecast by Region, 2026-2036 (US$ Billion, AGR %)
Figure 26 CAR-T Cell Therapy Segment Market Share Forecast by Region, 2026 & 2036 (%)
Figure 27 TCR-T Cell Therapy Segment Market Forecast by Region, 2026-2036 (US$ Billion, AGR %)
Figure 28 TCR-T Cell Therapy Segment Market Share Forecast by Region, 2026 & 2036 (%)
Figure 29 Others Segment Market Forecast by Region, 2026-2036 (US$ Billion, AGR %)
Figure 30 Others Segment Market Share Forecast by Region, 2026 & 2036 (%)
Figure 31 Gene Therapy Segment Market Forecast by Region, 2026-2036 (US$ Billion, AGR %)
Figure 32 Gene Therapy Segment Market Share Forecast by Region, 2026 & 2036 (%)
Figure 33 Gene Augmentation Therapy Segment Market Forecast by Region, 2026-2036 (US$ Billion, AGR %)
Figure 34 Gene Augmentation Therapy Segment Market Share Forecast by Region, 2026 & 2036 (%)
Figure 35 Gene Inhibition Therapy Segment Market Forecast by Region, 2026-2036 (US$ Billion, AGR %)
Figure 36 Gene Inhibition Therapy Segment Market Share Forecast by Region, 2026 & 2036 (%)
Figure 37 Gene Editing Segment Market Forecast by Region, 2026-2036 (US$ Billion, AGR %)
Figure 38 Gene Editing Segment Market Share Forecast by Region, 2026 & 2036 (%)
Figure 39 Others Segment Market Forecast by Region, 2026-2036 (US$ Billion, AGR %)
Figure 40 Others Segment Market Share Forecast by Region, 2026 & 2036 (%)
Figure 41 Cell & Gene Therapy Market by Indication: Market Attractiveness Index
Figure 42 Cell & Gene Therapy Market Forecast by Indication, 2026-2036 (US$ Billion, AGR %)
Figure 43 Cell & Gene Therapy Market Share Forecast by Indication, 2026, 2031, 2036 (%)
Figure 44 Oncology Segment Market Forecast by Region, 2026-2036 (US$ Billion, AGR %)
Figure 45 Oncology Segment Market Share Forecast by Region, 2026 & 2036 (%)
Figure 46 Genetic Disorders Segment Market Forecast by Region, 2026-2036 (US$ Billion, AGR %)
Figure 47 Genetic Disorders Segment Market Share Forecast by Region, 2026 & 2036 (%)
Figure 48 Cardiovascular Disorders Segment Market Forecast by Region, 2026-2036 (US$ Billion, AGR %)
Figure 49 Cardiovascular Disorders Segment Market Share Forecast by Region, 2026 & 2036 (%)
Figure 50 Neurological Disorders Segment Market Forecast by Region, 2026-2036 (US$ Billion, AGR %)
Figure 51 Neurological Disorders Segment Market Share Forecast by Region, 2026 & 2036 (%)
Figure 52 Infectious Diseases Segment Market Forecast by Region, 2026-2036 (US$ Billion, AGR %)
Figure 53 Infectious Diseases Segment Market Share Forecast by Region, 2026 & 2036 (%)
Figure 54 Ophthalmic Disorders Segment Market Forecast by Region, 2026-2036 (US$ Billion, AGR %)
Figure 55 Ophthalmic Disorders Segment Market Share Forecast by Region, 2026 & 2036 (%)
Figure 56 Others Segment Market Forecast by Region, 2026-2036 (US$ Billion, AGR %)
Figure 57 Others Segment Market Share Forecast by Region, 2026 & 2036 (%)
Figure 58 Cell & Gene Therapy Market by Vector Type: Market Attractiveness Index
Figure 59 Cell & Gene Therapy Market Forecast by Vector Type, 2026-2036 (US$ Billion, AGR %)
Figure 60 Cell & Gene Therapy Market Share Forecast by Vector Type, 2026, 2031, 2036 (%)
Figure 61 Viral Vectors Segment Market Forecast by Region, 2026-2036 (US$ Billion, AGR %)
Figure 62 Viral Vectors Segment Market Share Forecast by Region, 2026 & 2036 (%)
Figure 63 Retrovirus Segment Market Forecast by Region, 2026-2036 (US$ Billion, AGR %)
Figure 64 Retrovirus Segment Market Share Forecast by Region, 2026 & 2036 (%)
Figure 65 Lentivirus Segment Market Forecast by Region, 2026-2036 (US$ Billion, AGR %)
Figure 66 Lentivirus Segment Market Share Forecast by Region, 2026 & 2036 (%)
Figure 67 Adenovirus Segment Market Forecast by Region, 2026-2036 (US$ Billion, AGR %)
Figure 68 Adenovirus Segment Market Share Forecast by Region, 2026 & 2036 (%)
Figure 69 AAV Segment Market Forecast by Region, 2026-2036 (US$ Billion, AGR %)
Figure 70 AAV Segment Market Share Forecast by Region, 2026 & 2036 (%)
Figure 71 Others Segment Market Forecast by Region, 2026-2036 (US$ Billion, AGR %)
Figure 72 Others Segment Market Share Forecast by Region, 2026 & 2036 (%)
Figure 73 Non-viral vectors Segment Market Forecast by Region, 2026-2036 (US$ Billion, AGR %)
Figure 74 Non-viral vectors Segment Market Share Forecast by Region, 2026 & 2036 (%)
Figure 75 Cell & Gene Therapy Market by End-user: Market Attractiveness Index
Figure 76 Cell & Gene Therapy Market Forecast by End-user, 2026-2036 (US$ Billion, AGR %)
Figure 77 Cell & Gene Therapy Market Share Forecast by End-user, 2026, 2031, 2036 (%)
Figure 78 Hospitals Segment Market Forecast by Region, 2026-2036 (US$ Billion, AGR %)
Figure 79 Hospitals Segment Market Share Forecast by Region, 2026 & 2036 (%)
Figure 80 Research Institutes Segment Market Forecast by Region, 2026-2036 (US$ Billion, AGR %)
Figure 81 Research Institutes Segment Market Share Forecast by Region, 2026 & 2036 (%)
Figure 82 Pharmaceutical Companies Segment Market Forecast by Region, 2026-2036 (US$ Billion, AGR %)
Figure 83 Pharmaceutical Companies Segment Market Share Forecast by Region, 2026 & 2036 (%)
Figure 84 Others Segment Market Forecast by Region, 2026-2036 (US$ Billion, AGR %)
Figure 85 Others Segment Market Share Forecast by Region, 2026 & 2036 (%)
Figure 86 Cell & Gene Therapy Market Forecast by Region 2025 and 2035 (Revenue, CAGR%)
Figure 87 Cell & Gene Therapy Market Share Forecast by Region 2026, 2031, 2036 (%)
Figure 88 Cell & Gene Therapy Market by Region, 2026-2036 (US$ Billion, AGR %)
Figure 89 North America Cell & Gene Therapy Market Attractiveness Index
Figure 90 North America Cell & Gene Therapy Market by Region, 2026, 2031 & 2036 (US$ Billion)
Figure 91 North America Cell & Gene Therapy Market Forecast by Country, 2026-2036 (US$ Billion, AGR %)
Figure 92 North America Cell & Gene Therapy Market Share Forecast by Country, 2026 & 2036 (%)
Figure 93 North America Cell & Gene Therapy Market Forecast by Therapy Type, 2026-2036 (US$ Billion, AGR %)
Figure 94 North America Cell & Gene Therapy Market Share Forecast by Therapy Type, 2026 & 2036 (%)
Figure 95 North America Cell & Gene Therapy Market Forecast by Indication, 2026-2036 (US$ Billion, AGR %)
Figure 96 North America Cell & Gene Therapy Market Share Forecast by Indication, 2026 & 2036 (%)
Figure 97 North America Cell & Gene Therapy Market Forecast by Vector Type, 2026-2036 (US$ Billion, AGR %)
Figure 98 North America Cell & Gene Therapy Market Share Forecast by Vector Type, 2026 & 2036 (%)
Figure 99 North America Cell & Gene Therapy Market Forecast by End-user, 2026-2036 (US$ Billion, AGR %)
Figure 100 North America Cell & Gene Therapy Market Share Forecast by End-user, 2026 & 2036 (%)
Figure 101 U.S. Cell & Gene Therapy Market Forecast, 2026-2036 (US$ Billion, AGR %)
Figure 102 Canada Cell & Gene Therapy Market Forecast, 2026-2036 (US$ Billion, AGR %)
Figure 103 Europe Cell & Gene Therapy Market Attractiveness Index
Figure 104 Europe Cell & Gene Therapy Market by Region, 2026, 2031 & 2036 (US$ Billion)
Figure 105 Europe Cell & Gene Therapy Market Forecast by Country, 2026-2036 (US$ Billion, AGR %)
Figure 106 Europe Cell & Gene Therapy Market Share Forecast by Country, 2026 & 2036 (%)
Figure 107 Europe Cell & Gene Therapy Market Forecast by Therapy Type, 2026-2036 (US$ Billion, AGR %)
Figure 108 Europe Cell & Gene Therapy Market Share Forecast by Therapy Type, 2026 & 2036 (%)
Figure 109 Europe Cell & Gene Therapy Market Forecast by Indication, 2026-2036 (US$ Billion, AGR %)
Figure 110 Europe Cell & Gene Therapy Market Share Forecast by Indication, 2026 & 2036 (%)
Figure 111 Europe Cell & Gene Therapy Market Forecast by Vector Type, 2026-2036 (US$ Billion, AGR %)
Figure 112 Europe Cell & Gene Therapy Market Share Forecast by Vector Type, 2026 & 2036 (%)
Figure 113 Europe Cell & Gene Therapy Market Forecast by End-user, 2026-2036 (US$ Billion, AGR %)
Figure 114 Europe Cell & Gene Therapy Market Share Forecast by End-user, 2026 & 2036 (%)
Figure 115 Germany Cell & Gene Therapy Market Forecast, 2026-2036 (US$ Billion, AGR %)
Figure 116 France Cell & Gene Therapy Market Forecast, 2026-2036 (US$ Billion, AGR %)
Figure 117 UK Cell & Gene Therapy Market Forecast, 2026-2036 (US$ Billion, AGR %)
Figure 118 Italy Cell & Gene Therapy Market Forecast, 2026-2036 (US$ Billion, AGR %)
Figure 119 Spain Cell & Gene Therapy Market Forecast, 2026-2036 (US$ Billion, AGR %)
Figure 120 Russia Cell & Gene Therapy Market Forecast, 2026-2036 (US$ Billion, AGR %)
Figure 121 Rest of Europe Cell & Gene Therapy Market Forecast, 2026-2036 (US$ Billion, AGR %)
Figure 122 Asia Pacific Cell & Gene Therapy Market Attractiveness Index
Figure 123 Asia Pacific Cell & Gene Therapy Market by Region, 2026, 2031 & 2036 (US$ Billion)
Figure 124 Asia Pacific Cell & Gene Therapy Market Forecast by Country, 2026-2036 (US$ Billion, AGR %)
Figure 125 Asia Pacific Cell & Gene Therapy Market Share Forecast by Country, 2026 & 2036 (%)
Figure 126 Asia Pacific Cell & Gene Therapy Market Forecast by Therapy Type, 2026-2036 (US$ Billion, AGR %)
Figure 127 Asia Pacific Cell & Gene Therapy Market Share Forecast by Therapy Type, 2026 & 2036 (%)
Figure 128 Asa Pacific Cell & Gene Therapy Market Forecast by Indication, 2026-2036 (US$ Billion, AGR %)
Figure 129 Asia Pacific Cell & Gene Therapy Market Share Forecast by Indication, 2026 & 2036 (%)
Figure 130 Asia Pacific Cell & Gene Therapy Market Forecast by Vector Type, 2026-2036 (US$ Billion, AGR %)
Figure 131 Asia Pacific Cell & Gene Therapy Market Share Forecast by Vector Type, 2026 & 2036 (%)
Figure 132 Asia Pacific Cell & Gene Therapy Market Forecast by End-user, 2026-2036 (US$ Billion, AGR %)
Figure 133 Asia Pacific Cell & Gene Therapy Market Share Forecast by End-user, 2026 & 2036 (%)
Figure 134 Japan Cell & Gene Therapy Market Forecast, 2026-2036 (US$ Billion, AGR %)
Figure 135 China Cell & Gene Therapy Market Forecast, 2026-2036 (US$ Billion, AGR %)
Figure 136 India Cell & Gene Therapy Market Forecast, 2026-2036 (US$ Billion, AGR %)
Figure 137 Australia Cell & Gene Therapy Market Forecast, 2026-2036 (US$ Billion, AGR %)
Figure 138 South Korea Cell & Gene Therapy Market Forecast, 2026-2036 (US$ Billion, AGR %)
Figure 139 Singapore Cell & Gene Therapy Market Forecast, 2026-2036 (US$ Billion, AGR %)
Figure 140 Rest of Asia Pacific Cell & Gene Therapy Market Forecast, 2026-2036 (US$ Billion, AGR %)
Figure 141 Latin America Cell & Gene Therapy Market Attractiveness Index
Figure 142 Latin America Cell & Gene Therapy Market by Region, 2026, 2031 & 2036 (US$ Billion)
Figure 143 Latin America Cell & Gene Therapy Market Forecast by Country, 2026-2036 (US$ Billion, AGR %)
Figure 144 Latin America Cell & Gene Therapy Market Share Forecast by Country, 2026 & 2036 (%)
Figure 145 Latin America Cell & Gene Therapy Market Forecast by Therapy Type, 2026-2036 (US$ Billion, AGR %)
Figure 146 Latin America Cell & Gene Therapy Market Share Forecast by Therapy Type, 2026 & 2036 (%)
Figure 147 Latin America Cell & Gene Therapy Market Forecast by Indication, 2026-2036 (US$ Billion, AGR %)
Figure 148 Latin America Cell & Gene Therapy Market Share Forecast by Indication, 2026 & 2036 (%)
Figure 149 Latin America Cell & Gene Therapy Market Forecast by Vector Type, 2026-2036 (US$ Billion, AGR %)
Figure 150 Latin America Cell & Gene Therapy Market Share Forecast by Vector Type, 2026 & 2036 (%)
Figure 151 Latin America Cell & Gene Therapy Market Forecast by End-user, 2026-2036 (US$ Billion, AGR %)
Figure 152 Latin America Cell & Gene Therapy Market Share Forecast by End-user, 2026 & 2036 (%)
Figure 153 Brazil Cell & Gene Therapy Market Forecast, 2026-2036 (US$ Billion, AGR %)
Figure 154 Mexico Cell & Gene Therapy Market Forecast, 2026-2036 (US$ Billion, AGR %)
Figure 155 Argentina Cell & Gene Therapy Market Forecast, 2026-2036 (US$ Billion, AGR %)
Figure 156 Rest of Latin America Cell & Gene Therapy Market Forecast, 2026-2036 (US$ Billion, AGR %)
Figure 157 MEA Cell & Gene Therapy Market Attractiveness Index
Figure 158 MEA Cell & Gene Therapy Market by Region, 2026, 2031 & 2036 (US$ Billion)
Figure 159 MEA Cell & Gene Therapy Market Forecast by Country, 2026-2036 (US$ Billion, AGR %)
Figure 160 MEA Cell & Gene Therapy Market Share Forecast by Country, 2026 & 2036 (%)
Figure 161 MEA Cell & Gene Therapy Market Forecast by Therapy Type, 2026-2036 (US$ Billion, AGR %)
Figure 162 MEA Cell & Gene Therapy Market Share Forecast by Therapy Type, 2026 & 2036 (%)
Figure 163 MEA Cell & Gene Therapy Market Forecast by Indication, 2026-2036 (US$ Billion, AGR %)
Figure 164 MEA Cell & Gene Therapy Market Share Forecast by Indication, 2026 & 2036 (%)
Figure 165 MEA Cell & Gene Therapy Market Forecast by Vector Type, 2026-2036 (US$ Billion, AGR %)
Figure 166 MEA & Gene Therapy Market Share Forecast by Vector Type, 2026 & 2036 (%)
Figure 167 MEA Cell & Gene Therapy Market Forecast by End-user, 2026-2036 (US$ Billion, AGR %)
Figure 168 MEA Cell & Gene Therapy Market Share Forecast by End-user, 2026 & 2036 (%)
Figure 169 GCC Cell & Gene Therapy Market Forecast, 2026-2036 (US$ Billion, AGR %)
Figure 170 South Africa Cell & Gene Therapy Market Forecast, 2026-2036 (US$ Billion, AGR %)
Figure 171 Rest of the MEA Cell & Gene Therapy Market Forecast, 2026-2036 (US$ Billion, AGR %)
Figure 172 Cell & Gene Therapy Market: Company Share/Ranking, 2026
Figure 173 Adaptimmune: Net Revenue, 2021-2024 (US$ Million, AGR%)
Figure 174 Adaptimmune: R&D, 2021-2024 (US$ Million, AGR%)
Figure 175 ALLOGENE THERAPEUTICS: Net Revenue, 2021-2024 (US$ Million, AGR%)
Figure 176 ALLOGENE THERAPEUTICS: R&D, 2021-2024 (US$ Million, AGR%)
Figure 177 Atara Biotherapeutics: Net Revenue, 2021-2024 (US$ Million, AGR%)
Figure 178 Atara Biotherapeutics: R&D, 2021-2024 (US$ Million, AGR%)
Figure 179 Beam Therapeutics: Net Revenue, 2021-2024 (US$ Million, AGR%)
Figure 180 Beam Therapeutics: R&D, 2021-2024 (US$ Million, AGR%)
Figure 181 BioMarin: Net Revenue, 2021-2025 (US$ Million, AGR%)
Figure 182 BioMarin: R&D, 2021-2025 (US$ Million, AGR%)
Figure 183 BioMarin: Regional Market Shares, 2025
Figure 184 Bristol-Myers Squibb Company.: Net Revenue, 2021-2025 (US$ Million, AGR%)
Figure 185 Bristol-Myers Squibb Company: R&D, 2021-2025 (US$ Million, AGR%)
Figure 186 Bristol-Myers Squibb Company: Regional Market Shares, 2024
Figure 187 Bristol-Myers Squibb Company: Business Segment Market Shares, 2024
Figure 188 Catalent Inc.: Net Revenue, 2021-2024 (US$ Million, AGR%)
Figure 189 Catalent Inc: Regional Market Shares, 2024
Figure 190 Catalent Inc: Business Segment Market Shares, 2024
Figure 191 CRISPR Therapeutics.: Net Revenue, 2021-2025 (US$ Million, AGR%)
Figure 192 CRISPR Therapeutics.: R&D, 2021-2024 (US$ Million, AGR%)
Figure 193 GenScript.: Net Revenue, 2021-2025 (US$ Million, AGR%)
Figure 194 GenScript: Regional Market Shares, 2024
Figure 195 GenScript: Business Segment Market Shares, 2025
Figure 196 Gilead Sciences, Inc.: Net Revenue, 2021-2025 (US$ Million, AGR%)
Figure 197 Gilead Sciences, Inc.: R&D, 2021-2025 (US$ Million, AGR%)
Figure 198 Gilead Sciences, Inc.: Regional Market Shares, 2025
Figure 199 Gilead Sciences, Inc.: Business Segment Market Shares, 2025
Figure 200 Intellia Therapeutics, Inc.: Net Revenue, 2021-2024 (US$ Million, AGR%)
Figure 201 Intellia Therapeutics, Inc.: R&D, 2021-2024 (US$ Million, AGR%)
Figure 202 Johnson & Johnson.: Net Revenue, 2021-2025 (US$ Million, AGR%)
Figure 203 Johnson & Johnson: R&D, 2021-2025 (US$ Million, AGR%)
Figure 204 Johnson & Johnson: Regional Market Shares, 2025
Figure 205 Johnson & Johnson: Business Segment Market Shares, 2025
Figure 206 Lonza: Net Revenue, 2021-2024 (US$ Million, AGR%)
Figure 207 Lonza: R&D, 2021-2024 (US$ Million, AGR%)
Figure 208 Lonza: Regional Market Shares, 2024
Figure 209 Lonza: Business Segment Market Shares, 2024
Figure 210 MeiraGTx Limited: Net Revenue, 2021-2024 (US$ Million, AGR%)
Figure 211 MeiraGTx Limited: R&D, 2021-2024 (US$ Million, AGR%)
Figure 212 Novartis AG.: Net Revenue, 2021-2025 (US$ Million, AGR%)
Figure 213 Novartis AG: R&D, 2021-2025 (US$ Million, AGR%)
Figure 214 Novartis AG: Regional Market Shares, 2025
Figure 215 Novartis AG: Business Segment Market Shares, 2025
Figure 216 Sarepta Therapeutics, Inc.: Net Revenue, 2021-2024 (US$ Million, AGR%)
Figure 217 Sarepta Therapeutics, Inc.: R&D, 2021-2024 (US$ Million, AGR%)
Figure 218 Sarepta Therapeutics, Inc.: Business Segment Market Shares, 2024
Figure 219 Ultragenyx Pharmaceutical Inc.: Net Revenue, 2021-2025 (US$ Million, AGR%)
Figure 220 Ultragenyx Pharmaceutical Inc.: R&D, 2021-2025 (US$ Million, AGR%)
Figure 221 Ultragenyx Pharmaceutical Inc.: Regional Market Shares, 2025
Figure 222 Vertex Pharmaceuticals Incorporated: Net Revenue, 2021-2025 (US$ Million, AGR%)
Figure 223 Vertex Pharmaceuticals Incorporated: R&D, 2021-2025 (US$ Million, AGR%)
Figure 224 Vertex Pharmaceuticals Incorporated: Regional Market Shares, 2024
ページTOPに戻る
本レポートと同じKEY WORD(gene)の最新刊レポート
よくあるご質問
Visiongain社はどのような調査会社ですか?
英国の調査会社ヴィジョンゲイン社(Visiongain)は、通信とエネルギーのほか、自動車や化学・医薬品、金属など、広範な市場を対象に調査を行っています。自動車市場については、市場全般に関する調査のほ... もっと見る
調査レポートの納品までの日数はどの程度ですか?
在庫のあるものは速納となりますが、平均的には 3-4日と見て下さい。
但し、一部の調査レポートでは、発注を受けた段階で内容更新をして納品をする場合もあります。
発注をする前のお問合せをお願いします。
注文の手続きはどのようになっていますか?
1)お客様からの御問い合わせをいただきます。
2)見積書やサンプルの提示をいたします。
3)お客様指定、もしくは弊社の発注書をメール添付にて発送してください。
4)データリソース社からレポート発行元の調査会社へ納品手配します。
5) 調査会社からお客様へ納品されます。最近は、pdfにてのメール納品が大半です。
お支払方法の方法はどのようになっていますか?
納品と同時にデータリソース社よりお客様へ請求書(必要に応じて納品書も)を発送いたします。
お客様よりデータリソース社へ(通常は円払い)の御振り込みをお願いします。
請求書は、納品日の日付で発行しますので、翌月最終営業日までの当社指定口座への振込みをお願いします。振込み手数料は御社負担にてお願いします。
お客様の御支払い条件が60日以上の場合は御相談ください。
尚、初めてのお取引先や個人の場合、前払いをお願いすることもあります。ご了承のほど、お願いします。
データリソース社はどのような会社ですか?
当社は、世界各国の主要調査会社・レポート出版社と提携し、世界各国の市場調査レポートや技術動向レポートなどを日本国内の企業・公官庁及び教育研究機関に提供しております。
世界各国の「市場・技術・法規制などの」実情を調査・収集される時には、データリソース社にご相談ください。
お客様の御要望にあったデータや情報を抽出する為のレポート紹介や調査のアドバイスも致します。
|
|


