眼科用医薬品市場レポート:2026-2036年
Ophthalmic Drugs Market Report 2026-2036
概要
眼科用医薬品市場レポート 2026-2036(米国通商関税の影響を含む)は、市場規模、成長要因、競合状況、主要治療分野別の売上予測など、世界市場に関する包括的な分析を提供します。
世界の眼... もっと見る
※上記価格は部署ライセンス(Departmental licence)価格です。
その他の価格についてはデータリソースまでお問合せください。
日本語のページは自動翻訳を利用し作成しています。
実際のレポートは英文のみでご納品いたします。

|
サマリー
概要
眼科用医薬品市場レポート 2026-2036(米国通商関税の影響を含む)は、市場規模、成長要因、競合状況、主要治療分野別の売上予測など、世界市場に関する包括的な分析を提供します。
世界の眼科用医薬品市場は、2026年に418億8,000万米ドルと推定され、網膜疾患の有病率の上昇、生物学的製剤の革新、およびAIを活用した網膜画像診断システムによる診断精度の向上に牽引され、2036年まで年平均成長率(CAGR)7.9%で成長すると予測されています。 本レポートは、適応症、薬剤分類、投与経路、流通チャネル、地域ごとの詳細な売上予測を提供し、製薬企業、投資家、戦略立案者が高成長の機会と競争上のリスクを特定するのを支援します。
市場拡大を牽引する技術革新
バイオ医薬品、遺伝子治療、デジタルヘルスプラットフォームにおける急速な技術進歩が、眼科分野の競争構造を再構築しています。 先進的な生物学的製剤や遺伝子ベースの治療法の開発が加速し続ける中、これらの治療法は投資の戦略的焦点として位置づけられており、複雑な科学をスケーラブルな治療法へと転換できる企業へと、将来の市場リーダーシップが移行する可能性を示唆しています。同時に、抗VEGF製剤は治療パイプラインの中心であり続けており、網膜疾患全般におけるその有効性に対する臨床的・商業的な信頼が持続していることを反映しています。
また、人工知能(AI)を活用したプラットフォームも変革の原動力として台頭しており、疾患の検出、診断、治療モニタリングにおける幅広い適用可能性から、戦略的買収企業や投資家からの強い関心を集めている。加齢黄斑変性、糖尿病性黄斑浮腫、網膜静脈閉塞症、ドライアイ症など、患者負担の大きい主要な適応症におけるイノベーションは、多額の資本流入によって支えられており、この分野が影響力の大きい治療領域に注力していることを裏付けている。 医薬品分野以外にも、患者のライフスタイルの変化や視力矯正ニーズの高まりが、光学製品の成長を支えています。消費者向け視力ケア市場では眼鏡が依然として主流ですが、コンタクトレンズへの需要増加を受け、メーカー各社は製品ポートフォリオの多様化と技術統合戦略の強化を進めています。
米国の貿易関税が世界の眼科用医薬品市場に与える影響
米国の貿易関税は、即時の需要混乱というよりは、調達戦略、価格形成のダイナミクス、および資本配分における構造的な変化を通じて、主に世界の眼科用医薬品市場に影響を与えるだろう。眼科用医薬品の製造、特にジェネリック医薬品や無菌注射剤の製造は、有効成分、包装資材、および特殊な製造用資材について、グローバルに統合されたサプライチェーンに依存している。米国への医薬品輸入品や中間体に対する関税の賦課は、調達コストを増加させ、長期供給契約に不確実性をもたらす可能性がある。
多国籍企業にとっては、リスクを軽減するために、地域ごとの製造拠点の分散や現地化戦略が加速する可能性がある。 輸出に依存したビジネスモデルを持つ中小メーカーは、より大きな財務的圧迫に直面する可能性があり、ジェネリック医薬品セグメント内での業界再編につながる恐れがある。中期的には、貿易関連のコスト圧力が、特に価格に敏感な市場において、支払者や流通業者との価格交渉に影響を与える可能性がある。高付加価値の特許取得済みバイオ医薬品は直接的な影響を受けにくいかもしれないが、関税をめぐる摩擦が長期化すれば、眼科用医薬品エコシステム全体における競争上の位置づけや供給のレジリエンスが再構築される可能性がある。
本レポートで回答する主な質問
-
2036年までの眼科用医薬品市場の予測規模は?
-
どの疾患カテゴリーが最も急速に成長し、最大の新規収益を生み出すか?
-
抗VEGF生物製剤は、新興の遺伝子治療とどのように競合するでしょうか?
-
予測期間中、どの地域および国内市場が特に好調となるか?
-
米国の貿易関税は、サプライチェーンや価格戦略にどのような影響を与えるか?
-
主要企業はどの企業であり、その市場シェアはどのように推移するでしょうか?
レポートの範囲とデータ対象
-
393ページにわたる詳細な市場分析
-
データ表146点、図表228点
-
2036年までの売上高予測
-
6つの分類層にわたるセグメントレベルのモデリング
-
5つの地域市場および26の主要国市場
-
20社以上の主要企業の競合プロファイリング
市場の動向、推進要因、阻害要因、ポーターの5つの力、PEST分析、戦略的展開を網羅した定量的予測および定性的分析を含みます。
セグメンテーションの枠組み
適応症別
-
網膜疾患
-加齢黄斑変性(AMD)
-糖尿病性網膜症/糖尿病性黄斑浮腫
-その他の網膜疾患
-
感染症/炎症/アレルギー
-
緑内障
-
ドライアイ
-
その他
タイプ別
投与経路別
流通チャネル別
医薬品タイプ別
医薬品分類別
-
抗VEGF薬
-
緑内障治療薬
-
抗炎症・抗感染薬
-
抗アレルギー薬
-
その他
対象地域
世界市場全体および各セグメントの売上予測に加え、以下の5つの地域および26の主要国市場における売上予測も掲載されています:
北米
欧州
-
ドイツ
-
イギリス
-
フランス
-
イタリア
-
スペイン
-
オランダ
-
スイス
-
その他の欧州地域
アジア太平洋
-
日本
-
中国
-
インド
-
オーストラリア
-
シンガポール
-
マレーシア
-
韓国
-
その他のアジア太平洋地域
ラテンアメリカ
-
ブラジル
-
メキシコ
-
アルゼンチン
-
チリ
-
その他のラテンアメリカ地域
中東・アフリカ
企業情報
競合分析では、以下を含む20社以上の主要企業を分析しています:
-
AbbVie Inc.
-
Alcon
-
Apellis Pharmaceuticals
-
Bayer AG
-
Bausch + Lomb Corporation
-
Breye Therapeutics ApS
-
EyeBio
-
F. Hoffmann-La Roche Ltd
-
Johnson & Johnson Services, Inc.
-
Nicox
-
Novartis AG
-
Novaliq GmbH
-
Pfizer Inc.
-
Regeneron Pharmaceuticals Inc.
-
Santen Pharmaceutical Co., Ltd.
-
SpliceBio
-
Sun Pharmaceutical Industries Ltd.
-
Teva Pharmaceutical Industries Ltd.
-
Viatris Inc.
各プロファイルでは、能力、パイプラインのポジショニング、戦略的展開、および商業的見通しを評価しています。
2026年から2036年までの眼科用医薬品市場レポートは、どのように役立つでしょうか?
要約すると、390ページ以上にわたる本レポートでは、以下の情報を提供しています。
-
2026年から2036年までの眼科用医薬品市場に関する2036年までの収益予測。適応症、種類、投与経路、流通チャネル、薬剤タイプ、薬剤クラスごとの予測を、グローバルおよび地域レベルで提供しています。業界の展望を把握し、投資と収益にとって最も収益性の高い分野を見つけ出してください。
-
5つの地域および26の主要国市場における2036年までの売上高予測 ? 北米、欧州、アジア太平洋、ラテンアメリカ、中東・アフリカ(MEA)における2026年から2036年までの眼科用医薬品市場の予測をご覧ください。また、米国、カナダ、メキシコ、ブラジル、ドイツ、フランス、英国、イタリア、中国、インド、日本、オーストラリアをはじめとする主要経済圏の市場予測も掲載されています。
-
2026年から2036年までの眼科用医薬品市場に関わる主要企業20社の企業プロファイルを含め、既存企業および市場参入を目指す企業への展望。
本市場インテリジェンスの重要性
眼科用医薬品市場は、分子レベルの競争からライフサイクル管理および製造規模への移行期にあります。抗VEGF生物製剤、バイオシミラーの参入、および遺伝子治療の革新が、主要な網膜疾患セグメント全体における競争上の位置づけを再構築しています。
関税リスク、サプライチェーンの再構築、および地域ごとの償還動向を先読みできる企業は、2036年までの期間において、利益率を守り、長期的な成長を確実に捉えるための有利な立場に立つことができるでしょう。
ページTOPに戻る
目次
1 レポートの概要
1.1 本調査の目的
1.2 眼科用医薬品市場の概要
1.3 本レポートの内容
1.4 本レポートを読むべき理由
1.5 本分析レポートが回答する主な質問
1.6 本レポートの対象読者
1.7 調査方法
1.7.1 市場の定義
1.7.2 市場評価および予測の方法論
1.7.3 データの検証
1.7.3.1 一次調査
1.7.3.2 二次調査
1.8 よくある質問(FAQ)
1.9 関連するVisiongainレポート
1.10 Visiongainについて
2 エグゼクティブ・サマリー
3 市場概要
3.1 主な調査結果
3.2 市場動向
3.3 影響分析
3.3.1 市場を牽引する要因
3.3.1.1 眼疾患の罹患率および発症頻度の増加
3.3.1.2 技術の進歩とイノベーション
3.3.1.3 糖尿病有病率の増加
3.3.1.4 有力な開発中の新薬の存在
3.3.1.5 バイオ医薬品および抗VEGF薬の成長
3.3.2 市場の抑制要因
3.3.2.1 治療費の高額化と保険適用範囲の不足
3.3.2.2 利用可能な治療選択肢に関する認知度の低さ
3.3.2.3 安全性への懸念による普及の遅れ
3.3.2.4 ブロックバスター医薬品の特許満了
3.3.2.5 研究開発費の増加および主要医薬品の特許喪失が及ぼす影響
3.3.3 市場の機会
3.3.3.1 研究開発投資の増加
3.3.3.2 高齢人口の増加
3.3.3.3 デジタルヘルスソリューションと遠隔医療の台頭
3.3.3.4 眼科分野におけるイノベーションに対する規制面の支援強化
3.3.3.5 Eコマースとオンライン薬局がもたらす新たな市場機会
3.4 米国の関税:世界の眼科用医薬品市場への影響は?
3.4.1 概要
3.4.2 V字型回復シナリオ
3.4.3 なぜV字型回復なのか?
3.4.3.1 関税による影響
3.4.3.2 市場の動向と需要の回復
3.4.3.3 政策および資金面の支援
3.4.3.4 回復までの期間
3.4.4 U字型回復シナリオ
3.4.4.1 なぜU字型回復なのか?
3.4.4.2 関税の影響
3.4.4.3 市場の動向と需要の回復
3.4.4.4 政策および資金支援
3.4.4.5 回復までの期間
3.4.5 L字型回復シナリオ
3.4.5.1 なぜL字型回復なのか?
3.4.5.2 関税の影響
3.4.5.3 市場の動向と需要の回復
3.4.5.4 政策および資金支援
3.4.5.5 回復までの期間
3.4.6 顧客は短期(2026~2031年)および長期(2026~2036年)の計画において、どのような戦略的考慮事項を組み込むべきか?
3.4.7 米中貿易戦争が眼科用医薬品市場に与える影響
3.4.8 最も影響を受ける国々は、これらの政策変更によりどのようなプラスおよびマイナスの影響を受ける可能性があるか?
3.5 ポーターの5つの力分析
3.5.1 供給者の交渉力
3.5.2 購入者の交渉力
3.5.3 競合他社間の競争
3.5.4 代替品の脅威
3.5.5 新規参入者の脅威
3.6 PEST分析
4 眼科用医薬品市場分析:適応症別
4.1 主な調査結果
4.2 適応症セグメント:市場魅力度指数
4.3 適応症別眼科用医薬品市場規模の推計と予測
4.4 網膜疾患
4.4.1 地域別市場予測、2026年~2036年(10億米ドル、AGR%)
4.4.2 地域別市場シェア、2026年および2036年(%)
4.4.3 網膜疾患別市場予測、2026~2036年(10億米ドル、AGR%)
4.4.3.1 加齢黄斑変性(AMD)
4.4.3.2 糖尿病性網膜症/糖尿病性黄斑浮腫
4.4.3.3 その他の網膜疾患
4.5 感染症/炎症/アレルギー
4.5.1 地域別市場予測、2026~2036年(10億米ドル、AGR%)
4.5.2 地域別市場シェア、2026年および2036年(%)
4.6 緑内障
4.6.1 地域別市場予測、2026~2036年(10億米ドル、AGR%)
4.6.2 地域別市場シェア、2026年および2036年(%)
4.7 ドライアイ
4.7.1 地域別市場予測、2026~2036年(10億米ドル、AGR%)
4.7.2 地域別市場シェア、2026年および2036年(%)
4.8 その他
4.8.1 地域別市場予測、2026~2036年(10億米ドル、AGR%)
4.8.2 地域別市場シェア、2026年および2036年(%)
5 眼科用医薬品市場分析:タイプ別
5.1 主な調査結果
5.2 タイプ別セグメント:市場魅力度指数
5.3 眼科用医薬品のタイプ別市場規模の推定と予測
5.4 処方薬
5.4.1 地域別市場予測、2026~2036年(10億米ドル、AGR%)
5.4.2 地域別市場シェア、2026年および2036年(%)
5.5 一般用医薬品
5.5.1 地域別市場予測、2026年~2036年(10億米ドル、AGR%)
5.5.2 地域別市場シェア、2026年および2036年(%)
6 眼科用医薬品市場分析:投与経路別
6.1 主な調査結果
6.2 投与経路セグメント:市場魅力度指数
6.3 投与経路別眼科用医薬品市場規模の推定と予測
6.4 局所投与
6.4.1 地域別市場予測、2026~2036年(10億米ドル、AGR%)
6.4.2 地域別市場シェア、2026年および2036年(%)
6.5 注射剤
6.5.1 地域別市場予測、2026~2036年(10億米ドル、AGR%)
6.5.2 地域別市場シェア、2026年および2036年(%)
7 眼科用医薬品市場分析:流通チャネル別
7.1 主な調査結果
7.2 流通チャネルセグメント:市場魅力度指数
7.3 流通チャネル別眼科用医薬品市場規模の推定と予測
7.4 病院薬局
7.4.1 地域別市場予測、2026~2036年(10億米ドル、AGR%)
7.4.2 地域別市場シェア、2026年および2036年(%)
7.5 ドラッグストア
7.5.1 地域別市場予測、2026年~2036年(10億米ドル、AGR%)
7.5.2 地域別市場シェア、2026年および2036年(%)
7.6 オンライン薬局
7.6.1 地域別市場予測、2026~2036年(10億米ドル、AGR%)
7.6.2 地域別市場シェア、2026年および2036年(%)
8 眼科用医薬品市場分析:医薬品タイプ別
8.1 主な調査結果
8.2 医薬品タイプ別セグメント:市場魅力度指数
8.3 医薬品タイプ別眼科用医薬品市場規模の推定と予測
8.4 ブランド医薬品
8.4.1 地域別市場予測、2026~2036年(10億米ドル、AGR%)
8.4.2 地域別市場シェア、2026年および2036年(%)
8.5 ジェネリック医薬品
8.5.1 地域別市場予測、2026年~2036年(10億米ドル、AGR%)
8.5.2 地域別市場シェア、2026年および2036年(%)
9 眼科用医薬品市場分析:医薬品分類別
9.1 主な調査結果
9.2 医薬品分類セグメント:市場魅力度指数
9.3 医薬品分類別眼科用医薬品市場規模の推定と予測
9.4 抗VEGF剤
9.4.1 地域別市場予測、2026~2036年(10億米ドル、AGR%)
9.4.2 地域別市場シェア、2026年および2036年(%)
9.5 緑内障治療薬
9.5.1 地域別市場予測、2026年~2036年(10億米ドル、AGR%)
9.5.2 地域別市場シェア、2026年および2036年(%)
9.6 抗炎症・抗感染症薬
9.6.1 地域別市場予測、2026~2036年(10億米ドル、AGR%)
9.6.2 地域別市場シェア、2026年および2036年(%)
9.7 抗アレルギー薬
9.7.1 地域別市場予測、2026~2036年(10億米ドル、AGR%)
9.7.2 地域別市場シェア、2026年および2036年(%)
9.8 その他
9.8.1 地域別市場予測、2026~2036年(10億米ドル、AGR%)
9.8.2 地域別市場シェア、2026年および2036年(%)
10 眼科用医薬品市場分析:地域別
10.1 主な調査結果
10.2 地域別市場規模の推定と予測
11 北米の眼科用医薬品市場分析
11.1 主な調査結果
11.2 北米眼科用医薬品市場の魅力度指数
11.3 北米眼科用医薬品市場:国別、2026年、2031年、2036年(10億米ドル)
11.4 北米眼科用医薬品市場規模推定と予測:国別
11.5 北米眼科用医薬品市場規模推定と予測:適応症別
11.6 北米眼科用医薬品市場規模推定と予測:タイプ別
11.7 北米眼科用医薬品市場規模推定と予測:投与経路別
11.8 北米眼科用医薬品市場規模推定と予測:流通チャネル別
11.9 北米眼科用医薬品市場規模推定と予測:医薬品タイプ別
11.10 北米眼科用医薬品市場規模推定と予測:医薬品分類別
11.11 米国眼科用医薬品市場分析
11.12 カナダ眼科用医薬品市場分析
12 欧州の眼科用医薬品市場分析
12.1 主な調査結果
12.2 欧州眼科用医薬品市場の魅力度指数
12.3 欧州眼科用医薬品市場:国別、2026年、2031年、2036年(10億米ドル)
12.4 欧州眼科用医薬品市場規模推定と予測:国別
12.5 欧州眼科用医薬品市場規模推定と予測:適応症別
12.6 欧州眼科用医薬品市場規模推定と予測:タイプ別
12.7 欧州眼科用医薬品市場規模推定と予測:投与経路別
12.8 欧州眼科用医薬品市場規模推定と予測:流通チャネル別
12.9 欧州眼科用医薬品市場規模推定と予測:医薬品タイプ別
12.10 欧州眼科用医薬品市場規模推定と予測:分類別
12.11 ドイツ眼科用医薬品市場分析
12.12 英国眼科用医薬品市場分析
12.13 フランス眼科用医薬品市場分析
12.14 イタリア眼科用医薬品市場分析
12.15 スペイン眼科用医薬品市場分析
12.16 オランダ眼科用医薬品市場分析
12.17 スイス眼科用医薬品市場分析
12.18 その他の欧州地域眼科用医薬品市場分析
13 アジア太平洋地域の眼科用医薬品市場分析
13.1 主な調査結果
13.2 アジア太平洋地域眼科用医薬品市場魅力度指数
13.3 アジア太平洋地域眼科用医薬品市場:国別、2026年、2031年、2036年(10億米ドル)
13.4 アジア太平洋地域眼科用医薬品市場規模推定と予測:国別
13.5 アジア太平洋地域眼科用医薬品市場規模推定と予測:適応症別
13.6 アジア太平洋地域眼科用医薬品市場規模推定と予測:タイプ別
13.7 アジア太平洋地域眼科用医薬品市場規模推定と予測:投与経路別
13.8 アジア太平洋地域眼科用医薬品市場規模推定と予測:流通チャネル別
13.9 アジア太平洋地域眼科用医薬品市場規模推定と予測:医薬品タイプ別
13.10 アジア太平洋地域眼科用医薬品市場規模推定と予測:医薬品分類別
13.11 日本の眼科用医薬品市場分析
13.12 中国の眼科用医薬品市場分析
13.13 インドの眼科用医薬品市場分析
13.14 シンガポール眼科用医薬品市場分析
13.15 マレーシア眼科用医薬品市場分析
13.16 韓国眼科用医薬品市場分析
13.17 オーストラリア眼科用医薬品市場分析
13.18 その他のアジア太平洋地域眼科用医薬品市場分析
14 ラテンアメリカの眼科用医薬品市場分析
14.1 主な調査結果
14.2 ラテンアメリカ眼科用医薬品市場の魅力度指数
14.3 ラテンアメリカ眼科用医薬品市場:国別、2026年、2031年、2036年(10億米ドル)
14.4 ラテンアメリカ眼科用医薬品市場規模推定と予測:国別
14.5 ラテンアメリカ眼科用医薬品市場規模推定と予測:適応症別
14.6 ラテンアメリカ眼科用医薬品市場規模推定と予測:タイプ別
14.7 ラテンアメリカ眼科用医薬品市場規模推定と予測:投与経路別
14.8 ラテンアメリカ眼科用医薬品市場規模推定と予測:流通チャネル別
14.9 ラテンアメリカ眼科用医薬品市場規模推定と予測:医薬品タイプ別
14.10 ラテンアメリカ眼科用医薬品市場規模推定と予測:医薬品分類別
14.11 ブラジル眼科用医薬品市場分析
14.12 メキシコ眼科用医薬品市場分析
14.13 アルゼンチン眼科用医薬品市場分析
14.14 チリ眼科用医薬品市場分析
14.15 その他のラテンアメリカ諸国における眼科用医薬品市場分析
15 MEAの眼科用医薬品市場の分析
15.1 主な調査結果
15.2 MEA眼科用医薬品市場の魅力度指数
15.3 MEA眼科用医薬品市場:国別、2026年、2031年、2036年(10億米ドル)
15.4 MEA眼科用医薬品市場規模推定と予測:国別
15.5 MEA眼科用医薬品市場規模推定と予測:適応症別
15.6 MEA眼科用医薬品市場規模推定と予測:タイプ別
15.7 MEA眼科用医薬品市場規模推定と予測:投与経路別
15.8 MEA眼科用医薬品市場規模推定と予測:流通チャネル別
15.9 MEA眼科用医薬品市場規模推定と予測:医薬品タイプ別
15.10 MEA眼科用医薬品市場規模推定と予測:医薬品分類別
15.11 GCC 眼科用医薬品市場分析
15.12 南アフリカ眼科用医薬品市場分析
15.13 その他の MEA 眼科用医薬品市場分析
16 企業プロファイル
16.1 戦略的展望
16.2 ノバルティスAG
16.2.1 企業概要
16.2.2 会社概要
16.2.3 財務分析
16.2.3.1 純売上高、2020-2025年
16.2.3.2 地域別市場シェア、2025年
16.2.3.3 事業セグメント別市場シェア(2025年)
16.2.3.4 研究開発費(2020年~2025年)
16.2.4 製品ベンチマーク
16.2.5 戦略的展望
16.3 バイエルAG
16.3.1 企業概要
16.3.2 会社概要
16.3.3 財務分析
16.3.3.1 純売上高、2020-2024年
16.3.3.2 地域別市場シェア、2024年
16.3.3.3 事業セグメント別市場シェア、2024年
16.3.3.4 研究開発費、2020-2024年
16.3.4 製品ベンチマーク
16.3.5 戦略的展望
16.4 ファイザー社
16.4.1 企業概要
16.4.2 会社概要
16.4.3 財務分析
16.4.3.1 売上高(2020年~2024年)
16.4.3.2 研究開発費(2020年~2024年)
16.4.3.3 地域別市場シェア(2024年)
16.4.3.4 事業セグメント別市場シェア(2024年)
16.4.4 製品ベンチマーク
16.5 ボシュ・ロム社
16.5.1 企業概要
16.5.2 会社概要
16.5.3 財務分析
16.5.3.1 売上高(2020年~2024年)
16.5.3.2 研究開発費(2020年~2024年)
16.5.3.3 事業セグメント別市場シェア(2024年)
16.5.4 製品ベンチマーク
16.5.5 戦略的展望
16.6 三田製薬株式会社
16.6.1 企業概要
16.6.2 会社概要
16.6.3 財務分析
16.6.3.1 売上高(2020年~2025年)
16.6.3.2 地域別市場シェア(2025年)
16.6.4 製品ベンチマーク
16.6.5 戦略的展望
16.7 ジョンソン・エンド・ジョンソン・サービス社
16.7.1 企業概要
16.7.2 会社概要
16.7.3 財務分析
16.7.3.1 売上高(2020年~2025年)
16.7.3.2 地域別市場シェア(2025年)
16.7.3.3 事業セグメント別市場シェア(2025年)
16.7.3.4 研究開発費(2020年~2025年)
16.7.4 製品ベンチマーク
16.9 レジェネロン・ファーマシューティカルズ社
16.9.1 企業概要
16.9.2 会社概要
16.9.3 財務分析
16.9.3.1 売上高(2020年~2025年)
16.9.3.2 研究開発費(2020-2025年)
16.9.4 製品ベンチマーク
16.9.5 戦略的展望
16.10 アッヴィ社
16.10.1 企業概要
16.10.2 会社概要
16.10.3 財務分析
16.10.3.1 売上高、2020-2025年
16.10.3.2 地域別市場シェア、2025年
16.10.3.3 事業セグメント別市場シェア、2025年
16.10.3.4 研究開発費、2020-2025年
16.10.4 製品ベンチマーク
16.10.5 戦略的展望
16.11 F. ホフマン・ラ・ロシュ社
16.11.1 企業概要
16.11.2 会社概要
16.11.3 財務分析
16.11.3.1 売上高(2020年~2024年)
16.11.3.2 事業セグメント別市場シェア(2024年)
16.11.3.3 研究開発費(2020-2024年)
16.11.4 製品ベンチマーキング
16.11.5 戦略的展望
16.12 テバ・ファーマシューティカル・インダストリーズ社
16.12.1 企業概要
16.12.2 会社概要
16.12.3 財務分析
16.12.3.1 売上高、2020-2025年
16.12.3.2 地域別市場シェア、2025年
16.12.3.3 研究開発費、2020-2025年
16.12.4 製品ベンチマーク
16.12.5 戦略的展望
16.13 Apellis Pharmaceuticals
16.13.1 企業概要
16.13.2 会社概要
16.13.3 財務分析
16.13.3.1 売上高(2020年~2024年)
16.13.4 製品ベンチマーク
16.14 ノバリック(Novaliq GmbH)
16.14.1 企業概要
16.14.2 会社概要
16.14.3 製品ベンチマーク
16.14.4 戦略的展望
16.15 アイバイオ(EyeBio)
16.15.1 企業概要
16.15.2 会社概要
16.15.3 製品ベンチマーク
16.15.4 戦略的展望
16.17 SpliceBio
16.17.1 企業概要
16.17.2 会社概要
16.17.3 製品ベンチマーク
16.17.4 戦略的展望
16.18 Breye Therapeutics ApS
16.18.1 企業概要
16.18.2 会社概要
16.18.3 製品ベンチマーク
16.18.4 戦略的展望
16.19 Nicox
16.19.1 企業概要
16.19.2 会社概要
16.19.3 財務分析
16.19.3.1 純売上高(2020年~2024年)
16.19.5 製品ベンチマーク
16.19.6 戦略的展望
16.20 アルコン
16.20.1 企業概要
16.20.2 会社概要
16.20.3 財務分析
16.20.3.1 純売上高(2020年~2024年)
16.20.3.2 事業セグメント別市場シェア(2024年)
16.20.3.3 地域別市場シェア(2024年)
16.20.3.4 研究開発費(2020年~2024年)
16.20.4 製品ベンチマーク
16.20.5 戦略的展望
16.21 ヴィアトリス社
16.21.1 企業概要
16.21.2 会社概要
16.21.3 財務分析
16.21.3.1 純売上高、2020-2024年
16.21.3.2 地域別市場シェア(2024年)
16.21.3.3 研究開発費(2020-2024年)
16.21.4 製品ベンチマーク
16.21.5 戦略的展望
16.22 サン・ファーマシューティカル・インダストリーズ社
16.22.1 企業概要
16.22.2 会社概要
16.22.3 財務分析
16.22.3.1 純売上高(2020年~2025年)
16.22.3.2 研究開発費(2020年~2025年)
16.22.4 製品ベンチマーク
17 結論と提言
17.1 Visiongainによる総括
17.2 市場関係者への提言
ページTOPに戻る
図表リスト
List of Tables
Table 1 Ophthalmic Drugs Market Snapshot, 2026 & 2036 (US$ Billion, CAGR %)
Table 2 Ophthalmic Drugs Market: Product Pipeline
Table 3 Ophthalmic Drugs Market Forecast by Region, 2026-2036 (US$ Billion, AGR%, CAGR%): “V” Shaped Recovery
Table 4 Ophthalmic Drugs Market Forecast by Region, 2026-2036 (US$ Billion, AGR%, CAGR%): “U” Shaped Recovery
Table 5 Ophthalmic Drugs Market Forecast by Region, 2026-2036 (US$ Billion, AGR%, CAGR%): “L” Shaped Recovery
Table 6 Ophthalmic Drugs Market Forecast by Indication, 2026-2036 (US$ Billion, AGR %, CAGR %)
Table 7 Retinal Disorders Segment Market Forecast by Region, 2026-2036 (US$ Billion, AGR%, CAGR%)
Table 8 Retinal Disorders Segment by Type Forecast, 2026-2036 (US$ Million, AGR %, CAGR %)
Table 9 Infection/Inflammation/Allergy Segment Market Forecast by Region, 2026-2036 (US$ Billion, AGR%, CAGR%)
Table 10 Glaucoma Segment Market Forecast by Region, 2026-2036 (US$ Billion, AGR%, CAGR%)
Table 11 Dry Eye Segment Market Forecast by Region, 2026-2036 (US$ Billion, AGR%, CAGR%)
Table 12 Others Segment Market Forecast by Region, 2026-2036 (US$ Billion, AGR%, CAGR%)
Table 13 Ophthalmic Drugs Market Forecast by Type, 2026-2036 (US$ Billion, AGR %, CAGR %)
Table 14 Prescription Drugs Segment Market Forecast by Region, 2026-2036 (US$ Billion, AGR%, CAGR%)
Table 15 OTC Drugs Segment Market Forecast by Region, 2026-2036 (US$ Billion, AGR%, CAGR%)
Table 16 Ophthalmic Drugs Market Forecast by Route of Administration, 2026-2036 (US$ Billion, AGR %, CAGR %)
Table 17 Topical Segment Market Forecast by Region, 2026-2036 (US$ Billion, AGR%, CAGR%)
Table 18 Parenteral Segment Market Forecast by Region, 2026-2036 (US$ Billion, AGR%, CAGR%)
Table 19 Ophthalmic Drugs Market Forecast by Distribution Channel, 2026-2036 (US$ Billion, AGR %, CAGR %)
Table 20 Hospital Pharmacies Segment Market Forecast by Region, 2026-2036 (US$ Billion, AGR%, CAGR%)
Table 21 Drug Stores Segment Market Forecast by Region, 2026-2036 (US$ Billion, AGR%, CAGR%)
Table 22 Online Pharmacies Segment Market Forecast by Region, 2026-2036 (US$ Billion, AGR%, CAGR%)
Table 23 Ophthalmic Drugs Market Forecast by Drug Type, 2026-2036 (US$ Billion, AGR %, CAGR %)
Table 24 Branded Drugs Segment Market Forecast by Region, 2026-2036 (US$ Billion, AGR%, CAGR%)
Table 25 Generic Drugs Segment Market Forecast by Region, 2026-2036 (US$ Billion, AGR%, CAGR%)
Table 26 Ophthalmic Drugs Market Forecast by Drug Class, 2026-2036 (US$ Billion, AGR %, CAGR %)
Table 27 Anti-VEGF Agents Segment Market Forecast by Region, 2026-2036 (US$ Billion, AGR%, CAGR%)
Table 28 Anti-Glaucoma Drugs Segment Market Forecast by Region, 2026-2036 (US$ Billion, AGR%, CAGR%)
Table 29 Anti-Inflammatory & Anti-Infective Drugs Segment Market Forecast by Region, 2026-2036 (US$ Billion, AGR%, CAGR%)
Table 30 Anti-Allergy Drugs Segment Market Forecast by Region, 2026-2036 (US$ Billion, AGR%, CAGR%)
Table 31 Others Segment Market Forecast by Region, 2026-2036 (US$ Billion, AGR%, CAGR%)
Table 32 Ophthalmic Drugs Market Forecast by Region, 2026-2036 (US$ Billion, AGR%, CAGR%)
Table 33 North America Ophthalmic Drugs Market Forecast by Country, 2026-2036 (US$ Billion, AGR%, CAGR%)
Table 34 North America Ophthalmic Drugs Market Forecast by Indication, 2026-2036 (US$ Billion, AGR %, CAGR %)
Table 35 North America Ophthalmic Drugs Market Forecast by Type, 2026-2036 (US$ Billion, AGR %, CAGR %)
Table 36 North America Ophthalmic Drugs Market Forecast by Route of Administration, 2026-2036 (US$ Billion, AGR %, CAGR %)
Table 37 North America Ophthalmic Drugs Market Forecast by Distribution Channel, 2026-2036 (US$ Billion, AGR %, CAGR %)
Table 38 North America Ophthalmic Drugs Market Forecast by Drug Type, 2026-2036 (US$ Billion, AGR %, CAGR %)
Table 39 North America Ophthalmic Drugs Market Forecast by Drug Class, 2026-2036 (US$ Billion, AGR %, CAGR %)
Table 40 U.S. Ophthalmic Drugs Market Forecast, 2026-2036 (US$ Billion, AGR%, CAGR%)
Table 41 Canada Ophthalmic Drugs Market Forecast, 2026-2036 (US$ Billion, AGR%, CAGR%)
Table 42 Europe Ophthalmic Drugs Market Forecast by Country, 2026-2036 (US$ Billion, AGR%, CAGR%)
Table 43 Europe Ophthalmic Drugs Market Forecast by Indication, 2026-2036 (US$ Billion, AGR %, CAGR %)
Table 44 Europe Ophthalmic Drugs Market Forecast by Type, 2026-2036 (US$ Billion, AGR %, CAGR %)
Table 45 Europe Ophthalmic Drugs Market Forecast by Route of Administration, 2026-2036 (US$ Billion, AGR %, CAGR %)
Table 46 Europe Ophthalmic Drugs Market Forecast by Distribution Channel, 2026-2036 (US$ Billion, AGR %, CAGR %)
Table 47 Europe Ophthalmic Drugs Market Forecast by Drug Type, 2026-2036 (US$ Billion, AGR %, CAGR %)
Table 48 Europe Ophthalmic Drugs Market Forecast by Drug Class, 2026-2036 (US$ Billion, AGR %, CAGR %)
Table 49 Germany Ophthalmic Drugs Market Forecast, 2026-2036 (US$ Billion, AGR%, CAGR%)
Table 50 UK Ophthalmic Drugs Market Forecast, 2026-2036 (US$ Billion, AGR%, CAGR%)
Table 51 Italy Ophthalmic Drugs Market Forecast, 2026-2036 (US$ Billion, AGR%, CAGR%)
Table 52 Spain Ophthalmic Drugs Market Forecast, 2026-2036 (US$ Billion, AGR%, CAGR%)
Table 53 The Netherlands Ophthalmic Drugs Market Forecast, 2026-2036 (US$ Billion, AGR%, CAGR%)
Table 54 Switzerland Ophthalmic Drugs Market Forecast, 2026-2036 (US$ Billion, AGR%, CAGR%)
Table 55 Rest of Europe Ophthalmic Drugs Market Forecast, 2026-2036 (US$ Billion, AGR%, CAGR%)
Table 56 Asia Pacific Ophthalmic Drugs Market Forecast by Country, 2026-2036 (US$ Billion, AGR%, CAGR%)
Table 57 Asia Pacific Ophthalmic Drugs Market Forecast by Indication, 2026-2036 (US$ Billion, AGR %, CAGR %)
Table 58 Asia Pacific Ophthalmic Drugs Market Forecast by Type, 2026-2036 (US$ Billion, AGR %, CAGR %)
Table 59 Asia Pacific Ophthalmic Drugs Market Forecast by Route of Administration, 2026-2036 (US$ Billion, AGR %, CAGR %)
Table 60 Asia Pacific Ophthalmic Drugs Market Forecast by Distribution Channel, 2026-2036 (US$ Billion, AGR %, CAGR %)
Table 61 Asia Pacific Ophthalmic Drugs Market Forecast by Drug Type, 2026-2036 (US$ Billion, AGR %, CAGR %)
Table 62 Asia Pacific Ophthalmic Drugs Market Forecast by Drug Class, 2026-2036 (US$ Billion, AGR %, CAGR %)
Table 63 Japan Ophthalmic Drugs Market Forecast, 2026-2036 (US$ Billion, AGR%, CAGR%)
Table 64 China Ophthalmic Drugs Market Forecast, 2026-2036 (US$ Billion, AGR%, CAGR%)
Table 65 India Ophthalmic Drugs Market Forecast, 2026-2036 (US$ Billion, AGR%, CAGR%)
Table 66 Singapore Ophthalmic Drugs Market Forecast, 2026-2036 (US$ Billion, AGR%, CAGR%)
Table 67 Malaysia Ophthalmic Drugs Market Forecast, 2026-2036 (US$ Billion, AGR%, CAGR%)
Table 68 South Korea Ophthalmic Drugs Market Forecast, 2026-2036 (US$ Billion, AGR%, CAGR%)
Table 69 Australia Ophthalmic Drugs Market Forecast, 2026-2036 (US$ Billion, AGR%, CAGR%)
Table 70 Rest of Asia Pacific Ophthalmic Drugs Market Forecast, 2026-2036 (US$ Billion, AGR%, CAGR%)
Table 71 Latin America Ophthalmic Drugs Market Forecast by Country, 2026-2036 (US$ Billion, AGR%, CAGR%)
Table 72 Latin America Ophthalmic Drugs Market Forecast by Indication, 2026-2036 (US$ Billion, AGR %, CAGR %)
Table 73 Latin America Ophthalmic Drugs Market Forecast by Type, 2026-2036 (US$ Billion, AGR %, CAGR %)
Table 74 Latin America Ophthalmic Drugs Market Forecast by Route of Administration, 2026-2036 (US$ Billion, AGR %, CAGR %)
Table 75 Latin America Ophthalmic Drugs Market Forecast by Distribution Channel, 2026-2036 (US$ Billion, AGR %, CAGR %)
Table 76 Latin America Ophthalmic Drugs Market Forecast by Drug Type, 2026-2036 (US$ Billion, AGR %, CAGR %)
Table 77 Latin America Ophthalmic Drugs Market Forecast by Drug Class, 2026-2036 (US$ Billion, AGR %, CAGR %)
Table 78 Brazil Ophthalmic Drugs Market Forecast, 2026-2036 (US$ Billion, AGR%, CAGR%)
Table 79 Mexico Ophthalmic Drugs Market Forecast, 2026-2036 (US$ Billion, AGR%, CAGR%)
Table 80 Argentina Ophthalmic Drugs Market Forecast, 2026-2036 (US$ Billion, AGR%, CAGR%)
Table 81 Chile Ophthalmic Drugs Market Forecast, 2026-2036 (US$ Billion, AGR%, CAGR%)
Table 82 Rest of Latin America Ophthalmic Drugs Market Forecast, 2026-2036 (US$ Billion, AGR%, CAGR%)
Table 83 MEA Ophthalmic Drugs Market Forecast by Country, 2026-2036 (US$ Billion, AGR%, CAGR%)
Table 84 MEA Ophthalmic Drugs Market Forecast by Indication, 2026-2036 (US$ Billion, AGR %, CAGR %)
Table 85 MEA Ophthalmic Drugs Market Forecast by Type, 2026-2036 (US$ Billion, AGR %, CAGR %)
Table 86 MEA Ophthalmic Drugs Market Forecast by Route of Administration, 2026-2036 (US$ Billion, AGR %, CAGR %)
Table 87 MEA Ophthalmic Drugs Market Forecast by Distribution Channel, 2026-2036 (US$ Billion, AGR %, CAGR %)
Table 88 MEA Ophthalmic Drugs Market Forecast by Drug Type, 2026-2036 (US$ Billion, AGR %, CAGR %)
Table 89 MEA Ophthalmic Drugs Market Forecast by Drug Class, 2026-2036 (US$ Billion, AGR %, CAGR %)
Table 90 GCC Ophthalmic Drugs Market Forecast, 2026-2036 (US$ Billion, AGR%, CAGR%)
Table 91 South Africa Ophthalmic Drugs Market Forecast, 2026-2036 (US$ Billion, AGR%, CAGR%)
Table 92 Rest of MEA Ophthalmic Drugs Market Forecast, 2026-2036 (US$ Billion, AGR%, CAGR%)
Table 93 Strategic Outlook
Table 94 Novartis AG: Key Details, (CEO, HQ, Revenue, Founded, No. of Employees, Company Type, Website, Business Segment)
Table 95 Novartis AG: Product Benchmarking
Table 96 Novartis AG: Strategic Outlook
Table 97 Bayer AG: Key Details, (CEO, HQ, Revenue, Founded, No. of Employees, Company Type, Website, Business Segment)
Table 98 Bayer AG: Product Benchmarking
Table 99 Bayer AG: Strategic Outlook
Table 100 Pfizer Inc.: Key Details, (CEO, HQ, Revenue, Founded, No. of Employees, Company Type, Website, Business Segment)
Table 101 Pfizer Inc.: Product Benchmarking
Table 102 Bausch + Lomb Corporation: Key Details, (CEO, HQ, Revenue, Founded, No. of Employees, Company Type, Website, Business Segment)
Table 103 Bausch + Lomb Corporation: Product Benchmarking
Table 104 Bausch + Lomb Corporation: Strategic Outlook
Table 105 Santen Pharmaceutical Co., Ltd.: Key Details, (CEO, HQ, Revenue, Founded, No. of Employees, Company Type, Website, Business Segment)
Table 106 Santen Pharmaceutical Co., Ltd.: Product Benchmarking
Table 107 Santen Pharmaceutical Co., Ltd.: Strategic Outlook
Table 108 Johnson & Johnson Services Inc: Key Details, (CEO, HQ, Revenue, Founded, No. of Employees, Company Type, Website, Business Segment)
Table 109 Johnson & Johnson Private Limited: Product Benchmarking
Table 110 Regeneron Pharmaceuticals Inc.: Key Details, (CEO, HQ, Revenue, Founded, No. of Employees, Company Type, Website, Business Segment)
Table 111 Regeneron Pharmaceuticals Inc.: Product Benchmarking
Table 112 Regeneron Pharmaceuticals Inc.: Strategic Outlook
Table 113 AbbVie Inc.: Key Details, (CEO, HQ, Revenue, Founded, No. of Employees, Company Type, Website, Business Segment)
Table 114 AbbVie Inc.: Product Benchmarking
Table 115 AbbVie Inc.: Strategic Outlook
Table 116 F. Hoffmann-La Roche Ltd: Key Details, (CEO, HQ, Revenue, Founded, No. of Employees, Company Type, Website, Business Segment)
Table 117 F. Hoffmann-La Roche Ltd: Product Benchmarking
Table 118 F. Hoffmann-La Roche Ltd: Strategic Outlook
Table 119 Teva Pharmaceutical Industries Ltd.: Key Details, (CEO, HQ, Revenue, Founded, No. of Employees, Company Type, Website, Business Segment)
Table 120 Teva Pharmaceutical Industries Ltd.: Product Benchmarking
Table 121 Teva Pharmaceutical Industries Ltd.: Strategic Outlook
Table 122 Apellis Pharmaceuticals: Key Details, (CEO, HQ, Revenue, Founded, No. of Employees, Company Type, Website, Business Segment)
Table 123 Apellis Pharmaceuticals: Product Benchmarking
Table 124 Novaliq GmbH: Key Details, (CEO, HQ, Revenue, Founded, No. of Employees, Company Type, Website, Business Segment)
Table 125 Novaliq GmbH.: Product Benchmarking
Table 126 Novaliq GmbH: Strategic Outlook
Table 127 EyeBio: Key Details, (CEO, HQ, Revenue, Founded, No. of Employees, Company Type, Website, Business Segment)
Table 128 EyeBio: Product Benchmarking
Table 129 EyeBio: Strategic Outlook
Table 130 SpliceBio: Key Details, (CEO, HQ, Revenue, Founded, No. of Employees, Company Type, Website, Business Segment)
Table 131 SpliceBio: Product Benchmarking
Table 132 SpliceBio: Strategic Outlook
Table 133 Breye Therapeutics ApS: Key Details, (CEO, HQ, Revenue, Founded, No. of Employees, Company Type, Website, Business Segment)
Table 134 Breye Therapeutics ApS: Product Benchmarking
Table 135 Breye Therapeutics ApS: Strategic Outlook
Table 136 Nicox: Key Details, (CEO, HQ, Revenue, Founded, No. of Employees, Company Type, Website, Business Segment)
Table 137 Nicox: Product Benchmarking
Table 138 Nicox: Strategic Outlook
Table 139 Alcon: Key Details, (CEO, HQ, Revenue, Founded, No. of Employees, Company Type, Website, Business Segment)
Table 140 Alcon: Product Benchmarking
Table 141 Alcon: Strategic Outlook
Table 142 Viatris Inc.: Key Details, (CEO, HQ, Revenue, Founded, No. of Employees, Company Type, Website, Business Segment)
Table 143 Viatris Inc.: Product Benchmarking
Table 144 Viatris Inc.: Strategic Outlook
Table 145 Sun Pharmaceutical Industries Ltd.: Key Details, (CEO, HQ, Revenue, Founded, No. of Employees, Company Type, Website, Business Segment)
Table 146 Sun Pharmaceutical Industries Ltd.: Product Benchmarking
List of Figures
Figure 1 Ophthalmic Drugs Market Segmentation
Figure 2 Ophthalmic Drugs Market by Indication: Market Attractiveness Index
Figure 3 Ophthalmic Drugs Market by Type: Market Attractiveness Index
Figure 4 Ophthalmic Drugs Market by Route of Administration: Market Attractiveness Index
Figure 5 Ophthalmic Drugs Market by Distribution Channel: Market Attractiveness Index
Figure 6 Ophthalmic Drugs Market by Drug Type: Market Attractiveness Index
Figure 7 Ophthalmic Drugs Market by Drug Class: Market Attractiveness Index
Figure 8 Ophthalmic Drugs Market Attractiveness Index by Region
Figure 9 Ophthalmic Drugs Market: Market Dynamics
Figure 10 Ophthalmic Drugs Market: Impact Analysis
Figure 11 Ophthalmic Drugs Market by Region, 2026-2036 (US$ Billion, AGR %), Tariff Impact: V-Shaped Recovery Scenario
Figure 12 Ophthalmic Drugs Market by Region, 2026-2036 (US$ Billion, AGR %), Tariff Impact: U-Shaped Recovery Scenario
Figure 13 Ophthalmic Drugs Market by Region, 2026-2036 (US$ Billion, AGR %), Tariff Impact: L-Shaped Recovery Scenario
Figure 14 Short Term & Long-Term Planning
Figure 15 Impact of U.S. and China Trade War
Figure 16 Most Impacted Countries
Figure 17 Ophthalmic Drugs Market: Porter’s Five Forces Analysis
Figure 18 Ophthalmic Drugs Market: PEST Analysis
Figure 19 Ophthalmic Drugs Market Attractiveness Index by Indication
Figure 20 Ophthalmic Drugs Market Forecast by Indication, 2026-2036 (US$ Billion, AGR %)
Figure 21 Ophthalmic Drugs Market Share Forecast by Indication, 2026, 2031, 2036 (%)
Figure 22 Retinal Disorders Segment Market Forecast by Region, 2026-2036 (US$ Billion, AGR %)
Figure 23 Retinal Disorders Segment Market Share Forecast by Region, 2026 & 2036 (%)
Figure 24 Retinal Disorders Segment Market Forecast by Type, 2026-2036 (US$ Billion, AGR %)
Figure 25 Infection/Inflammation/Allergy Segment Market Forecast by Region, 2026-2036 (US$ Billion, AGR %)
Figure 26 Infection/Inflammation/Allergy Segment Market Share Forecast by Region, 2026 & 2036 (%)
Figure 27 Glaucoma Segment Market Forecast by Region, 2026-2036 (US$ Billion, AGR %)
Figure 28 Glaucoma Segment Market Share Forecast by Region, 2026 & 2036 (%)
Figure 29 Dry Eye Segment Market Forecast by Region, 2026-2036 (US$ Billion, AGR %)
Figure 30 Dry Eye Segment Market Share Forecast by Region, 2026 & 2036 (%)
Figure 31 Others Segment Market Forecast by Region, 2026-2036 (US$ Billion, AGR %)
Figure 32 Others Segment Market Share Forecast by Region, 2026 & 2036 (%)
Figure 33 Ophthalmic Drugs Market Attractiveness Index by Indication
Figure 34 Ophthalmic Drugs Market Forecast by Type, 2026-2036 (US$ Billion, AGR %)
Figure 35 Ophthalmic Drugs Market Share Forecast by Type, 2026, 2031, 2036 (%)
Figure 36 Prescription Drugs Segment Market Forecast by Region, 2026-2036 (US$ Billion, AGR %)
Figure 37 Prescription Drugs Segment Market Share Forecast by Region, 2026 & 2036 (%)
Figure 38 OTC Drugs Segment Market Forecast by Region, 2026-2036 (US$ Billion, AGR %)
Figure 39 OTC Drugs Segment Market Share Forecast by Region, 2026 & 2036 (%)
Figure 40 Ophthalmic Drugs Market Attractiveness Index by Route of Administration
Figure 41 Ophthalmic Drugs Market Forecast by Route of Administration, 2026-2036 (US$ Billion, AGR %)
Figure 42 Ophthalmic Drugs Market Share Forecast by Route of Administration, 2026, 2031, 2036 (%)
Figure 43 Topical Segment Market Forecast by Region, 2026-2036 (US$ Billion, AGR %)
Figure 44 Topical Segment Market Share Forecast by Region, 2026 & 2036 (%)
Figure 45 Parenteral Segment Market Forecast by Region, 2026-2036 (US$ Billion, AGR %)
Figure 46 Parenteral Segment Market Share Forecast by Region, 2026 & 2036 (%)
Figure 47 Ophthalmic Drugs Market Attractiveness Index by Distribution Channel
Figure 48 Ophthalmic Drugs Market Forecast by Distribution Channel, 2026-2036 (US$ Billion, AGR %)
Figure 49 Ophthalmic Drugs Market Share Forecast by Distribution Channel, 2026, 2031, 2036 (%)
Figure 50 Hospital Pharmacies Segment Market Forecast by Region, 2026-2036 (US$ Billion, AGR %)
Figure 51 Hospital Pharmacies Segment Market Share Forecast by Region, 2026 & 2036 (%)
Figure 52 Drug Stores Segment Market Forecast by Region, 2026-2036 (US$ Billion, AGR %)
Figure 53 Drug Stores Segment Market Share Forecast by Region, 2026 & 2036 (%)
Figure 54 Online Pharmacies Segment Market Forecast by Region, 2026-2036 (US$ Billion, AGR %)
Figure 55 Online Pharmacies Segment Market Share Forecast by Region, 2026 & 2036 (%)
Figure 56 Ophthalmic Drugs Market Attractiveness Index by Drug Type
Figure 57 Ophthalmic Drugs Market Forecast by Drug Type, 2026-2036 (US$ Billion, AGR %)
Figure 58 Ophthalmic Drugs Market Share Forecast by Drug Type, 2026, 2031, 2036 (%)
Figure 59 Branded Drugs Segment Market Forecast by Region, 2026-2036 (US$ Billion, AGR %)
Figure 60 Branded Drugs Segment Market Share Forecast by Region, 2026 & 2036 (%)
Figure 61 Generic Drugs Segment Market Forecast by Region, 2026-2036 (US$ Billion, AGR %)
Figure 62 Generic Drugs Segment Market Share Forecast by Region, 2026 & 2036 (%)
Figure 63 Ophthalmic Drugs Market Attractiveness Index by Drug Class
Figure 64 Ophthalmic Drugs Market Forecast by Drug Class, 2026-2036 (US$ Billion, AGR %)
Figure 65 Ophthalmic Drugs Market Share Forecast by Drug Class, 2026, 2031, 2036 (%)
Figure 66 Anti-VEGF Agents Segment Market Forecast by Region, 2026-2036 (US$ Billion, AGR %)
Figure 67 Anti-VEGF Agents Segment Market Share Forecast by Region, 2026 & 2036 (%)
Figure 68 Anti-Glaucoma Drugs Segment Market Forecast by Region, 2026-2036 (US$ Billion, AGR %)
Figure 69 Anti-Glaucoma Drugs Segment Market Share Forecast by Region, 2026 & 2036 (%)
Figure 70 Anti-Inflammatory & Anti-Infective Drugs Segment Market Forecast by Region, 2026-2036 (US$ Billion, AGR %)
Figure 71 Anti-Inflammatory & Anti-Infective Drugs Segment Market Share Forecast by Region, 2026 & 2036 (%)
Figure 72 Anti-Allergy Drugs Segment Market Forecast by Region, 2026-2036 (US$ Billion, AGR %)
Figure 73 Anti-Allergy Drugs Segment Market Share Forecast by Region, 2026 & 2036 (%)
Figure 74 Others Segment Market Forecast by Region, 2026-2036 (US$ Billion, AGR %)
Figure 75 Others Segment Market Share Forecast by Region, 2026 & 2036 (%)
Figure 76 Ophthalmic Drugs Market Forecast by Region 2026, 2031, 2036 (Revenue, CAGR%)
Figure 77 Ophthalmic Drugs Market Share Forecast by Region 2026, 2031, 2036 (%)
Figure 78 Ophthalmic Drugs Market by Region, 2026-2036 (US$ Billion, AGR %)
Figure 79 North America Ophthalmic Drugs Market Attractiveness Index
Figure 80 North America Ophthalmic Drugs Market by Region, 2026, 2031 & 2036 (US$ Billion)
Figure 81 North America Ophthalmic Drugs Market Forecast by Country, 2026-2036 (US$ Billion, AGR %)
Figure 82 North America Ophthalmic Drugs Market Share Forecast by Country, 2026 & 2036 (%)
Figure 83 North America Ophthalmic Drugs Market Forecast by Indication, 2026-2036 (US$ Billion, AGR %)
Figure 84 North America Ophthalmic Drugs Market Share Forecast by Indication, 2026 & 2036 (%)
Figure 85 North America Ophthalmic Drugs Market Forecast by Type, 2026-2036 (US$ Billion, AGR %)
Figure 86 North America Ophthalmic Drugs Market Share Forecast by Type, 2026 & 2036 (%)
Figure 87 North America Ophthalmic Drugs Market Forecast by Route of Administration, 2026-2036 (US$ Billion, AGR %)
Figure 88 North America Ophthalmic Drugs Market Share Forecast by Route of Administration, 2026 & 2036 (%)
Figure 89 North America Ophthalmic Drugs Market Forecast by Distribution Channel, 2026-2036 (US$ Billion, AGR %)
Figure 90 North America Ophthalmic Drugs Market Share Forecast by Distribution Channel, 2026 & 2036 (%)
Figure 91 North America Ophthalmic Drugs Market Forecast by Drug Type, 2026-2036 (US$ Billion, AGR %)
Figure 92 North America Ophthalmic Drugs Market Share Forecast by Drug Type, 2026 & 2036 (%)
Figure 93 North America Ophthalmic Drugs Market Forecast by Drug Class, 2026-2036 (US$ Billion, AGR %)
Figure 94 North America Ophthalmic Drugs Market Share Forecast by Drug Class, 2026 & 2036 (%)
Figure 95 U.S. Ophthalmic Drugs Market Forecast, 2026-2036 (US$ Billion, AGR %)
Figure 96 Canada Ophthalmic Drugs Market Forecast, 2026-2036 (US$ Billion, AGR %)
Figure 97 Europe Ophthalmic Drugs Market Attractiveness Index
Figure 98 Europe Ophthalmic Drugs Market by Region, 2026, 2031 & 2036 (US$ Billion)
Figure 99 Europe Ophthalmic Drugs Market Forecast by Country, 2026-2036 (US$ Billion, AGR %)
Figure 100 Europe Ophthalmic Drugs Market Share Forecast by Country, 2026 & 2036 (%)
Figure 101 Europe Ophthalmic Drugs Market Forecast by Indication, 2026-2036 (US$ Billion, AGR %)
Figure 102 Europe Ophthalmic Drugs Market Share Forecast by Indication, 2026 & 2036 (%)
Figure 103 Europe Ophthalmic Drugs Market Forecast by Type, 2026-2036 (US$ Billion, AGR %)
Figure 104 Europe Ophthalmic Drugs Market Share Forecast by Type, 2026 & 2036 (%)
Figure 105 Europe Ophthalmic Drugs Market Forecast by Route of Administration, 2026-2036 (US$ Billion, AGR %)
Figure 106 Europe Ophthalmic Drugs Market Share Forecast by Route of Administration, 2026 & 2036 (%)
Figure 107 Europe Ophthalmic Drugs Market Forecast by Distribution Channel, 2026-2036 (US$ Billion, AGR %)
Figure 108 Europe Ophthalmic Drugs Market Share Forecast by Distribution Channel, 2026 & 2036 (%)
Figure 109 Europe Ophthalmic Drugs Market Forecast by Drug Type, 2026-2036 (US$ Billion, AGR %)
Figure 110 Europe Ophthalmic Drugs Market Share Forecast by Drug Type, 2026 & 2036 (%)
Figure 111 Europe Ophthalmic Drugs Market Forecast by Drug Class, 2026-2036 (US$ Billion, AGR %)
Figure 112 Europe Ophthalmic Drugs Market Share Forecast by Drug Class, 2026 & 2036 (%)
Figure 113 Germany Ophthalmic Drugs Market Forecast, 2026-2036 (US$ Billion, AGR %)
Figure 114 UK Ophthalmic Drugs Market Forecast, 2026-2036 (US$ Billion, AGR %)
Figure 115 France Ophthalmic Drugs Market Forecast, 2026-2036 (US$ Billion, AGR %)
Figure 116 Italy Ophthalmic Drugs Market Forecast, 2026-2036 (US$ Billion, AGR %)
Figure 117 Spain Ophthalmic Drugs Market Forecast, 2026-2036 (US$ Billion, AGR %)
Figure 118 The Netherlands Ophthalmic Drugs Market Forecast, 2026-2036 (US$ Billion, AGR %)
Figure 119 Switzerland Ophthalmic Drugs Market Forecast, 2026-2036 (US$ Billion, AGR %)
Figure 120 Rest of Europe Ophthalmic Drugs Market Forecast, 2026-2036 (US$ Billion, AGR %)
Figure 121 Asia Pacific Ophthalmic Drugs Market Attractiveness Index
Figure 122 Asia Pacific Ophthalmic Drugs Market by Region, 2026, 2031 & 2036 (US$ Billion)
Figure 123 Asia Pacific Ophthalmic Drugs Market Forecast by Country, 2026-2036 (US$ Billion, AGR %)
Figure 124 Asia Pacific Ophthalmic Drugs Market Share Forecast by Country, 2026 & 2036 (%)
Figure 125 Asia Pacific Ophthalmic Drugs Market Forecast by Indication, 2026-2036 (US$ Billion, AGR %)
Figure 126 Asia Pacific Ophthalmic Drugs Market Share Forecast by Indication, 2026 & 2036 (%)
Figure 127 Asia Pacific Ophthalmic Drugs Market Forecast by Type, 2026-2036 (US$ Billion, AGR %)
Figure 128 Asia Pacific Ophthalmic Drugs Market Share Forecast by Type, 2026 & 2036 (%)
Figure 129 Asia Pacific Ophthalmic Drugs Market Forecast by Route of Administration, 2026-2036 (US$ Billion, AGR %)
Figure 130 Asia Pacific Ophthalmic Drugs Market Share Forecast by Route of Administration, 2026 & 2036 (%)
Figure 131 Asia Pacific Ophthalmic Drugs Market Forecast by Distribution Channel, 2026-2036 (US$ Billion, AGR %)
Figure 132 Asia Pacific Ophthalmic Drugs Market Share Forecast by Distribution Channel, 2026 & 2036 (%)
Figure 133 Asia Pacific Ophthalmic Drugs Market Forecast by Drug Type, 2026-2036 (US$ Billion, AGR %)
Figure 134 Asia Pacific Ophthalmic Drugs Market Share Forecast by Drug Type, 2026 & 2036 (%)
Figure 135 Asia Pacific Ophthalmic Drugs Market Forecast by Drug Class, 2026-2036 (US$ Billion, AGR %)
Figure 136 Asia Pacific Ophthalmic Drugs Market Share Forecast by Drug Class, 2026 & 2036 (%)
Figure 137 Japan Ophthalmic Drugs Market Forecast, 2026-2036 (US$ Billion, AGR %)
Figure 138 China Ophthalmic Drugs Market Forecast, 2026-2036 (US$ Billion, AGR %)
Figure 139 India Ophthalmic Drugs Market Forecast, 2026-2036 (US$ Billion, AGR %)
Figure 140 Singapore Ophthalmic Drugs Market Forecast, 2026-2036 (US$ Billion, AGR %)
Figure 141 Malaysia Ophthalmic Drugs Market Forecast, 2026-2036 (US$ Billion, AGR %)
Figure 142 South Korea Ophthalmic Drugs Market Forecast, 2026-2036 (US$ Billion, AGR %)
Figure 143 Australia Ophthalmic Drugs Market Forecast, 2026-2036 (US$ Billion, AGR %)
Figure 144 Rest of Asia Pacific Ophthalmic Drugs Market Forecast, 2026-2036 (US$ Billion, AGR %)
Figure 145 Latin America Ophthalmic Drugs Market Attractiveness Index
Figure 146 Latin America Ophthalmic Drugs Market by Region, 2026, 2031 & 2036 (US$ Billion)
Figure 147 Latin America Ophthalmic Drugs Market Forecast by Country, 2026-2036 (US$ Billion, AGR %)
Figure 148 Latin America Ophthalmic Drugs Market Share Forecast by Country, 2026 & 2036 (%)
Figure 149 Latin America Ophthalmic Drugs Market Forecast by Indication, 2026-2036 (US$ Billion, AGR %)
Figure 150 Latin America Ophthalmic Drugs Market Share Forecast by Indication, 2026 & 2036 (%)
Figure 151 Latin America Ophthalmic Drugs Market Forecast by Type, 2026-2036 (US$ Billion, AGR %)
Figure 152 Latin America Ophthalmic Drugs Market Share Forecast by Type, 2026 & 2036 (%)
Figure 153 Latin America Ophthalmic Drugs Market Forecast by Route of Administration, 2026-2036 (US$ Billion, AGR %)
Figure 154 Latin America Ophthalmic Drugs Market Share Forecast by Route of Administration, 2026 & 2036 (%)
Figure 155 Latin America Ophthalmic Drugs Market Forecast by Distribution Channel, 2026-2036 (US$ Billion, AGR %)
Figure 156 Latin America Ophthalmic Drugs Market Share Forecast by Distribution Channel, 2026 & 2036 (%)
Figure 157 Latin America Ophthalmic Drugs Market Forecast by Drug Type, 2026-2036 (US$ Billion, AGR %)
Figure 158 Latin America Ophthalmic Drugs Market Share Forecast by Drug Type, 2026 & 2036 (%)
Figure 159 Latin America Ophthalmic Drugs Market Forecast by Drug Class, 2026-2036 (US$ Billion, AGR %)
Figure 160 Latin America Ophthalmic Drugs Market Share Forecast by Drug Class, 2026 & 2036 (%)
Figure 161 Brazil Ophthalmic Drugs Market Forecast, 2026-2036 (US$ Billion, AGR %)
Figure 162 Mexico Ophthalmic Drugs Market Forecast, 2026-2036 (US$ Billion, AGR %)
Figure 163 Argentina Ophthalmic Drugs Market Forecast, 2026-2036 (US$ Billion, AGR %)
Figure 164 Chole Ophthalmic Drugs Market Forecast, 2026-2036 (US$ Billion, AGR %)
Figure 165 Rest of Latin America Ophthalmic Drugs Market Forecast, 2026-2036 (US$ Billion, AGR %)
Figure 166 MEA Ophthalmic Drugs Market Attractiveness Index
Figure 167 MEA Ophthalmic Drugs Market by Region, 2026, 2031 & 2036 (US$ Billion)
Figure 168 MEA Ophthalmic Drugs Market Forecast by Country, 2026-2036 (US$ Billion, AGR %)
Figure 169 MEA Ophthalmic Drugs Market Share Forecast by Country, 2026 & 2036 (%)
Figure 170 MEA Ophthalmic Drugs Market Forecast by Indication, 2026-2036 (US$ Billion, AGR %)
Figure 171 MEA Ophthalmic Drugs Market Share Forecast by Indication, 2026 & 2036 (%)
Figure 172 MEA Ophthalmic Drugs Market Forecast by Type, 2026-2036 (US$ Billion, AGR %)
Figure 173 MEA Ophthalmic Drugs Market Share Forecast by Type, 2026 & 2036 (%)
Figure 174 MEA Ophthalmic Drugs Market Forecast by Route of Administration, 2026-2036 (US$ Billion, AGR %)
Figure 175 MEA Ophthalmic Drugs Market Share Forecast by Route of Administration, 2026 & 2036 (%)
Figure 176 MEA Ophthalmic Drugs Market Forecast by Distribution Channel, 2026-2036 (US$ Billion, AGR %)
Figure 177 MEA Ophthalmic Drugs Market Share Forecast by Distribution Channel, 2026 & 2036 (%)
Figure 178 MEA Ophthalmic Drugs Market Forecast by Drug Type, 2026-2036 (US$ Billion, AGR %)
Figure 179 MEA Ophthalmic Drugs Market Share Forecast by Drug Type, 2026 & 2036 (%)
Figure 180 MEA Ophthalmic Drugs Market Forecast by Drug Class, 2026-2036 (US$ Billion, AGR %)
Figure 181 MEA Ophthalmic Drugs Market Share Forecast by Drug Class, 2026 & 2036 (%)
Figure 182 GCC Ophthalmic Drugs Market Forecast, 2026-2036 (US$ Billion, AGR %)
Figure 183 South Africa Ophthalmic Drugs Market Forecast, 2026-2036 (US$ Billion, AGR %)
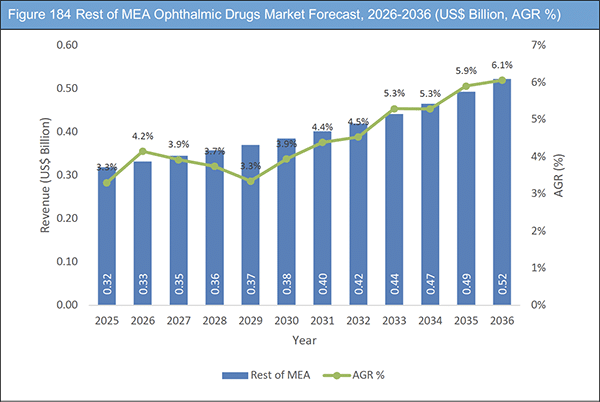
Figure 184 Rest of MEA Ophthalmic Drugs Market Forecast, 2026-2036 (US$ Billion, AGR %)
Figure 185 Novartis AG: Net Revenue, 2020-2025 (US$ Million, AGR %)
Figure 186 Novartis AG: Regional Market Shares (%), 2025
Figure 187 Novartis AG: Business Segment Market Shares (%), 2025
Figure 188 Novartis AG: R&D Expense, 2020-2025 (US$ Million, AGR %)
Figure 189 Bayer AG: Net Revenue, 2020-2024 (US$ Million, AGR %)
Figure 190 Bayer AG: Regional Market Shares (%), 2024
Figure 191 Bayer AG: Business Segment Market Shares (%), 2024
Figure 192 Bayer AG: R&D Expense, 2020-2024 (US$ Million, AGR %)
Figure 193 Pfizer Inc.: Net Revenue, 2020-2024 (US$ Million, AGR %)
Figure 194 Pfizer Inc.: R&D Expense, 2020-2024 (US$ Million, AGR %)
Figure 195 Pfizer Inc.: Regional Market Shares (%), 2024
Figure 196 Pfizer Inc.: Business Segment Market Shares (%), 2024
Figure 197 Bausch + Lomb Corporation: Revenue, 2020-2024 (US$ Million, AGR %)
Figure 198 Bausch + Lomb Corporation: R&D Expense, 2020-2024 (US$ Million, AGR %)
Figure 199 Bausch + Lomb Corporation.: Business Segment Market Shares (%), 2024
Figure 200 Santen Pharmaceutical Co., Ltd.: Annual Revenue, 2020-2025 (US$ Million, AGR %)
Figure 201 Santen Pharmaceutical Co., Ltd.: Regional Market Shares (%), 2025
Figure 202 Johnson & Johnson Services, Inc.: Annual Revenue, 2020-2025 (US$ Million, AGR %)
Figure 203 Johnson & Johnson Services, Inc.: Regional Market Shares (%), 2025
Figure 204 Johnson & Johnson Services, Inc.: Business Segment Market Shares (%), 2025
Figure 205 Johnson & Johnson Services Inc.: R&D Expense, 2020-2025 (US$ Million, AGR %)
Figure 206 Regeneron Pharmaceuticals Inc.: Annual Revenue, 2020-2025 (US$ Million, AGR %)
Figure 207 Regeneron Pharmaceuticals Inc: R&D Expense, 2020-2025 (US$ Million, AGR %)
Figure 208 AbbVie Inc.: Annual Revenue, 2020-2025 (US$ Million, AGR %)
Figure 209 AbbVie: Regional Market Shares (%), 2025
Figure 210 AbbVie: Business Segment Market Shares (%), 2025
Figure 211 AbbVie Inc.: R&D Expense, 2020-2025 (US$ Million, AGR %)
Figure 212 F. Hoffmann-La Roche Ltd: Net Revenue, 2020-2024 (US$ Million, AGR %)
Figure 213 F. Hoffmann-La Roche Ltd.: Business Segment Market Shares (%), 2024
Figure 214 F. Hoffmann-La Roche Ltd: R&D Expense, 2020-2024 (US$ Million, AGR %)
Figure 215 Teva Pharmaceutical Industries Ltd.: Annual Revenue, 2020-2025 (US$ Million, AGR%)
Figure 216 Teva Pharmaceutical Industries Ltd.: Regional Market Shares (%), 2025
Figure 217 Teva Pharmaceutical Industries Ltd.: R&D Expense, 2020-2025 (US$ Million, AGR %)
Figure 218 Apellis Pharmaceuticals: Annual Revenue, 2020-2024 (US$ Million, AGR %)
Figure 219 Nicox: Net Revenue, 2020-2024 (US$ Million, AGR %)
Figure 220 Alcon: Net Revenue, 2020-2024 (US$ Million, AGR %)
Figure 221 Alcon: Business Segment Market Shares (%), 2024
Figure 222 Alcon: Regional Market Shares (%), 2024
Figure 223 Alcon: R&D Expense, 2020-2024 (US$ Million, AGR %)
Figure 224 Viatris Inc.: Net Revenue, 2020-2024 (US$ Million, AGR %)
Figure 225 Viatris Inc.: Regional Market Shares (%), 2024
Figure 226 Viatris Inc.: R&D Expense, 2020-2024 (US$ Million, AGR %)
Figure 227 Sun Pharmaceutical Industries Ltd.: Net Revenue, 2020-2025 (US$ Million, AGR %)
Figure 228 Sun Pharmaceutical Industries Ltd.: R&D Expense, 2020-2025 (US$ Million, AGR %)
ページTOPに戻る
Summary
Description
The Ophthalmic Drugs Market Report 2026-2036 (Including Impact of U.S. Trade Tariffs) provides a comprehensive analysis of the global market, including market size, growth drivers, competitive positioning, and revenue forecasts across key therapeutic segments.
The global ophthalmic drugs market is estimated at US$41.88 billion in 2026 and is projected to grow at a 7.9% CAGR through 2036, driven by the rising prevalence of retinal disorders, biologic innovation, and better diagnostics via AI-enabled retinal imaging systems. This report delivers detailed revenue forecasts by indication, drug class, route of administration, distribution channel, and region, supporting pharmaceutical companies, investors, and strategic planners in identifying high-growth opportunities and competitive risks.
Technological Innovation Driving Market Expansion
Rapid technological progress across biologics, gene therapies, and digital health platforms is reshaping competitive dynamics within ophthalmology. Continued acceleration in the development of advanced biologic therapies and gene-based interventions is positioning these modalities as strategic focal points for investment, signalling a potential shift in future market leadership toward companies capable of translating complex science into scalable treatments. At the same time, anti-VEGF agents remain central to therapeutic pipelines, reflecting sustained clinical and commercial confidence in their efficacy across retinal disorders.
Artificial intelligence–enabled platforms are also emerging as a transformative force, attracting strong interest from strategic acquirers and investors due to their broad applicability in disease detection, diagnostics, and treatment monitoring. Significant capital inflows are supporting innovation across key high-burden indications, including age-related macular degeneration, diabetic macular Oedema, retinal vein occlusion, and dry eye disease, underscoring the sector’s focus on high-impact therapeutic areas. Beyond pharmaceuticals, evolving patient lifestyles and increasing visual-correction needs are sustaining growth in optical products; while eyeglasses continue to dominate consumer vision care, rising demand for contact lenses is prompting manufacturers to strengthen portfolio diversification and technology integration strategies.
Impact of US Trade Tariffs on the Global Ophthalmic Drugs Market
US trade tariffs would primarily affect the global ophthalmic drugs market through structural shifts in sourcing strategy, pricing dynamics, and capital allocation rather than immediate demand disruption. Ophthalmic drug manufacturing, particularly for generics and sterile injectables, depends on globally integrated supply chains for active pharmaceutical ingredients, packaging components, and specialised manufacturing inputs. Tariff imposition on pharmaceutical imports or intermediates into the United States could increase procurement costs and introduce uncertainty into long-term supply contracts.
For multinational companies, this may accelerate regional manufacturing diversification and localisation strategies to mitigate exposure. Smaller manufacturers with concentrated export models could face greater financial strain, potentially leading to consolidation within the generics segment. In the medium term, trade-related cost pressures may influence pricing negotiations with payers and distributors, particularly in price-sensitive markets. While high-value patented biologics may be less directly affected, sustained tariff friction could reshape competitive positioning and supply resilience across the broader ophthalmic drugs ecosystem.
Key Questions Answered in This Report
-
What is the projected size of the ophthalmic drugs market by 2036?
-
Which disease categories will grow fastest and generate the most new revenue?
-
How will anti-VEGF biologics compete with emerging gene therapies?
-
Which regions and national markets will outperform during the forecast period?
-
How will US trade tariffs influence supply chains and pricing strategies?
-
Who are the leading players and how will their market shares evolve?
Report Scope and Data Coverage
-
393 pages of in-depth market analysis
-
146 data tables and 228 charts
-
Revenue forecasts to 2036
-
Segment-level modelling across six classification layers
-
Five regional markets and 26 leading national markets
-
Competitive profiling of 20 + major companies
Includes quantitative forecasting and qualitative analysis covering market dynamics, drivers, restraints, Porter’s Five Forces, PEST analysis and strategic developments.
Segmentation Framework
By Indication
– Age-related Macular Degeneration (AMD)
– Diabetic Retinopathy/Diabetic Macular Oedema
– Other Retinal Disorders
-
Infection/Inflammation/Allergy
-
Glaucoma
-
Dry Eye
-
Others
By Type
-
Prescription Drugs
-
OTC Drugs
By Route of Administration
By Distribution Channel
-
Hospital Pharmacies
-
Drug Stores
-
Online Pharmacies
By Drug Type
-
Branded Drugs
-
Generic Drugs
By Drug Class
-
Anti-VEGF Agents
-
Anti-Glaucoma Drugs
-
Anti-Inflammatory & Anti-Infective Drugs
-
Anti-Allergy Drugs
-
Others
Geographic Coverage
In addition to the revenue predictions for the overall world market and segments, you will also find revenue forecasts for five regional and 26 leading national markets:
North America
Europe
-
Germany
-
UK
-
France
-
Italy
-
Spain
-
The Netherlands
-
Switzerland
-
Rest of Europe
Asia Pacific
-
Japan
-
China
-
India
-
Australia
-
Singapore
-
Malaysia
-
South Korea
-
Rest of Asia Pacific
Latin America
-
Brazil
-
Mexico
-
Argentina
-
Chile
-
Rest of Latin America
MEA
-
GCC
-
South Africa
-
Rest of MEA
Company Intelligence
Competitive analysis profiles 20+ major participants, including:
-
AbbVie Inc.
-
Alcon
-
Apellis Pharmaceuticals
-
Bayer AG
-
Bausch + Lomb Corporation
-
Breye Therapeutics ApS
-
EyeBio
-
F. Hoffmann-La Roche Ltd
-
Johnson & Johnson Services, Inc.
-
Nicox
-
Novartis AG
-
Novaliq GmbH
-
Pfizer Inc.
-
Regeneron Pharmaceuticals Inc.
-
Santen Pharmaceutical Co., Ltd.
-
SpliceBio
-
Sun Pharmaceutical Industries Ltd.
-
Teva Pharmaceutical Industries Ltd.
-
Viatris Inc.
Profiles assess capabilities, pipeline positioning, strategic developments and commercial outlook.
How will the Ophthalmic Drugs Market, 2026 to 2036 report help you?
In summary, our 390+ page report provides you with the following knowledge:
-
Revenue forecasts to 2036 for the Ophthalmic Drugs Market 2026 to 2036, with forecasts for Indication, Type, Route of Administration, Distribution Channel, Drug Type, Drug Class, each forecast at a global and regional level – discover the industry’s prospects, finding the most lucrative places for investments and revenues.
-
Revenue forecasts to 2036 for five regional and 26 key national markets – See forecasts for the Ophthalmic Drugs Market, 2026 to 2036 market in North America, Europe, Asia-Pacific, Latin America, and MEA. Also forecasted is the market in the US, Canada, Mexico, Brazil, Germany, France, UK, Italy, China, India, Japan, and Australia, among other prominent economies.
-
Prospects for established firms and those seeking to enter the market, including company profiles for 20 of the major companies involved in the Ophthalmic Drugs Market, 2026 to 2036.
Why This Market Intelligence Matters
The ophthalmic drugs market is transitioning from molecule-level competition toward lifecycle management and manufacturing scale. Anti-VEGF biologics, biosimilar entry and gene therapy innovation are reshaping competitive positioning across major retinal segments.
Companies that anticipate tariff exposure, supply chain restructuring and regional reimbursement dynamics will be better positioned to protect margins and capture long-term growth through 2036.
ページTOPに戻る
Table of Contents
1 Report Overview
1.1 Objectives of the Study
1.2 Introduction to Ophthalmic Drugs Market
1.3 What This Report Delivers
1.4 Why You Should Read This Report
1.5 Key Questions Answered by This Analytical Report Include:
1.6 Who is This Report For?
1.7 Methodology
1.7.1 Market Definitions
1.7.2 Market Evaluation & Forecasting Methodology
1.7.3 Data Validation
1.7.3.1 Primary Research
1.7.3.2 Secondary Research
1.8 Frequently Asked Questions (FAQs)
1.9 Associated Visiongain Reports
1.10 About Visiongain
2 Executive Summary
3 Market Overview
3.1 Key Findings
3.2 Market Dynamics
3.3 Impact Analysis
3.3.1 Market Driving Factors
3.3.1.1 Rising Frequency and Occurrence of Eye-related Conditions
3.3.1.2 Technological Advancements and Innovations
3.3.1.3 Increasing Prevalence of Diabetes
3.3.1.4 Presence of Strong Emerging Pipeline Drugs
3.3.1.5 Growth of Biologics and Anti-VEGF Agents
3.3.2 Market Restraining Factors
3.3.2.1 High Treatment Cost and Lack of Insurance Coverage
3.3.2.2 Lack of Awareness Regarding the Available Treatment Options
3.3.2.3 Safety Concerns Leading Slow Uptake
3.3.2.4 Patent Expiry of Blockbuster Drugs
3.3.2.5 Impact of Elevated R&D Expenses and Patent Loss on Popular Pharmaceuticals
3.3.3 Market Opportunities
3.3.3.1 Rise in Investment in Research and Development
3.3.3.2 Rise in Geriatric Population
3.3.3.3 Emergence of Digital Health Solutions and Telemedicine
3.3.3.4 Growing Regulatory Support for Innovation in the Ophthalmic Sector
3.3.3.5 E-Commerce and Online Pharmacies Unlock New Market Opportunities
3.4 U.S. Tariffs: What’s the Impact on Global Ophthalmic Drugs Market?
3.4.1 Overview
3.4.2 V-Shaped Recovery Scenario
3.4.3 Why V-Shaped Recovery?
3.4.3.1 Impact from Tariffs
3.4.3.2 Market Dynamics and Demand Recovery
3.4.3.3 Policy and Funding Support
3.4.3.4 Timeframe for Recovery
3.4.4 U-Shaped Recovery Scenario
3.4.4.1 Why U-Shaped Recovery?
3.4.4.2 Impact from Tariffs
3.4.4.3 Market Dynamics and Demand Recovery
3.4.4.4 Policy and Funding Support
3.4.4.5 Timeframe for Recovery
3.4.5 L Shaped Recovery Scenario
3.4.5.1 Why L-Shaped Recovery?
3.4.5.2 Impact from Tariffs
3.4.5.3 Market Dynamics and Demand Recovery
3.4.5.4 Policy and Funding Support
3.4.5.5 Timeframe for Recovery
3.4.6 What Strategic Considerations Should Clients Factor into Their Near-term (2026–2031) and Long-term (2026–2036) Planning?
3.4.7 Impact of U.S. and China Trade War on Ophthalmic Drugs Market
3.4.8 How Might the Most Impacted Countries Experience Positive and Negative Effects Resulting from These Policy Changes?
3.5 Porter’s Five Forces Analysis
3.5.1 Bargaining Power of Suppliers
3.5.2 Bargaining Power of Buyers
3.5.3 Competitive Rivalry
3.5.4 Threat of Substitutes
3.5.5 Threat of New Entrants
3.6 PEST Analysis
4 Ophthalmic Drugs Market Analysis by Indication
4.1 Key Findings
4.2 Indication Segment: Market Attractiveness Index
4.3 Ophthalmic Drugs Market Size Estimation and Forecast by Indication
4.4 Retinal Disorders
4.4.1 Market Forecast by Region, 2026-2036 (US$ Billion, AGR %)
4.4.2 Market Share by Region, 2026 & 2036 (%)
4.4.3 Market Forecast by Retinal Disorders, 2026-2036 (US$ Billion, AGR %)
4.4.3.1 Age-related Macular Degeneration (AMD)
4.4.3.2 Diabetic Retinopathy / Diabetic Macular Edema
4.4.3.3 Other Retinal Disorders
4.5 Infection/Inflammation/Allergy
4.5.1 Market Forecast by Region, 2026-2036 (US$ Billion, AGR %)
4.5.2 Market Share by Region, 2026 & 2036 (%)
4.6 Glaucoma
4.6.1 Market Forecast by Region, 2026-2036 (US$ Billion, AGR %)
4.6.2 Market Share by Region, 2026 & 2036 (%)
4.7 Dry Eye Disease
4.7.1 Market Forecast by Region, 2026-2036 (US$ Billion, AGR %)
4.7.2 Market Share by Region, 2026 & 2036 (%)
4.8 Others
4.8.1 Market Forecast by Region, 2026-2036 (US$ Billion, AGR %)
4.8.2 Market Share by Region, 2026 & 2036 (%)
5 Ophthalmic Drugs Market Analysis by Type
5.1 Key Findings
5.2 Type Segment: Market Attractiveness Index
5.3 Ophthalmic Drugs Market Size Estimation and Forecast by Type
5.4 Prescription Drugs
5.4.1 Market Forecast by Region, 2026-2036 (US$ Billion, AGR %)
5.4.2 Market Share by Region, 2026 & 2036 (%)
5.5 OTC Drugs
5.5.1 Market Forecast by Region, 2026-2036 (US$ Billion, AGR %)
5.5.2 Market Share by Region, 2026 & 2036 (%)
6 Ophthalmic Drugs Market Analysis by Route of Administration
6.1 Key Findings
6.2 Route of Administration Segment: Market Attractiveness Index
6.3 Ophthalmic Drugs Market Size Estimation and Forecast by Route of Administration
6.4 Topical
6.4.1 Market Forecast by Region, 2026-2036 (US$ Billion, AGR %)
6.4.2 Market Share by Region, 2026 & 2036 (%)
6.5 Parenteral
6.5.1 Market Forecast by Region, 2026-2036 (US$ Billion, AGR %)
6.5.2 Market Share by Region, 2026 & 2036 (%)
7 Ophthalmic Drugs Market Analysis by Distribution Channel
7.1 Key Findings
7.2 Distribution Channel Segment: Market Attractiveness Index
7.3 Ophthalmic Drugs Market Size Estimation and Forecast by Distribution Channel
7.4 Hospital Pharmacies
7.4.1 Market Forecast by Region, 2026-2036 (US$ Billion, AGR %)
7.4.2 Market Share by Region, 2026 & 2036 (%)
7.5 Drug Stores
7.5.1 Market Forecast by Region, 2026-2036 (US$ Billion, AGR %)
7.5.2 Market Share by Region, 2026 & 2036 (%)
7.6 Online Pharmacies
7.6.1 Market Forecast by Region, 2026-2036 (US$ Billion, AGR %)
7.6.2 Market Share by Region, 2026 & 2036 (%)
8 Ophthalmic Drugs Market Analysis by Drug Type
8.1 Key Findings
8.2 Drug Type Segment: Market Attractiveness Index
8.3 Ophthalmic Drugs Market Size Estimation and Forecast by Drug Type
8.4 Branded Drugs
8.4.1 Market Forecast by Region, 2026-2036 (US$ Billion, AGR %)
8.4.2 Market Share by Region, 2026 & 2036 (%)
8.5 Generic Drugs
8.5.1 Market Forecast by Region, 2026-2036 (US$ Billion, AGR %)
8.5.2 Market Share by Region, 2026 & 2036 (%)
9 Ophthalmic Drugs Market Analysis by Drug Class
9.1 Key Findings
9.2 Drug Class Segment: Market Attractiveness Index
9.3 Ophthalmic Drugs Market Size Estimation and Forecast by Drug Class
9.4 Anti-VEGF Agents
9.4.1 Market Forecast by Region, 2026-2036 (US$ Billion, AGR %)
9.4.2 Market Share by Region, 2026 & 2036 (%)
9.5 Anti-Glaucoma Drugs
9.5.1 Market Forecast by Region, 2026-2036 (US$ Billion, AGR %)
9.5.2 Market Share by Region, 2026 & 2036 (%)
9.6 Anti-Inflammatory & Anti-Infective Drugs
9.6.1 Market Forecast by Region, 2026-2036 (US$ Billion, AGR %)
9.6.2 Market Share by Region, 2026 & 2036 (%)
9.7 Anti-Allergy Drugs
9.7.1 Market Forecast by Region, 2026-2036 (US$ Billion, AGR %)
9.7.2 Market Share by Region, 2026 & 2036 (%)
9.8 Others
9.8.1 Market Forecast by Region, 2026-2036 (US$ Billion, AGR %)
9.8.2 Market Share by Region, 2026 & 2036 (%)
10 Ophthalmic Drugs Market Analysis by Region
10.1 Key Findings
10.2 Regional Market Size Estimation and Forecast
11 North America Ophthalmic Drugs Market Analysis
11.1 Key Findings
11.2 North America Ophthalmic Drugs Market Attractiveness Index
11.3 North America Ophthalmic Drugs Market by Country, 2026, 2031 & 2036 (US$ Billion)
11.4 North America Ophthalmic Drugs Market Size Estimation and Forecast by Country
11.5 North America Ophthalmic Drugs Market Size Estimation and Forecast by Indication
11.6 North America Ophthalmic Drugs Market Size Estimation and Forecast by Type
11.7 North America Ophthalmic Drugs Market Size Estimation and Forecast by Route of Administration
11.8 North America Ophthalmic Drugs Market Size Estimation and Forecast by Distribution Channel
11.9 North America Ophthalmic Drugs Market Size Estimation and Forecast by Drug Type
11.10 North America Ophthalmic Drugs Market Size Estimation and Forecast by Drug Class
11.11 U.S. Ophthalmic Drugs Market Analysis
11.12 Canada Ophthalmic Drugs Market Analysis
12 Europe Ophthalmic Drugs Market Analysis
12.1 Key Findings
12.2 Europe Ophthalmic Drugs Market Attractiveness Index
12.3 Europe Ophthalmic Drugs Market by Country, 2026, 2031 & 2036 (US$ Billion)
12.4 Europe Ophthalmic Drugs Market Size Estimation and Forecast by Country
12.5 Europe Ophthalmic Drugs Market Size Estimation and Forecast by Indication
12.6 Europe Ophthalmic Drugs Market Size Estimation and Forecast by Type
12.7 Europe Ophthalmic Drugs Market Size Estimation and Forecast by Route of Administration
12.8 Europe Ophthalmic Drugs Market Size Estimation and Forecast by Distribution Channel
12.9 Europe Ophthalmic Drugs Market Size Estimation and Forecast by Drug Type
12.10 Europe Ophthalmic Drugs Market Size Estimation and Forecast by Drug Class
12.11 Germany Ophthalmic Drugs Market Analysis
12.12 UK Ophthalmic Drugs Market Analysis
12.13 France Ophthalmic Drugs Market Analysis
12.14 Italy Ophthalmic Drugs Market Analysis
12.15 Spain Ophthalmic Drugs Market Analysis
12.16 The Netherlands Ophthalmic Drugs Market Analysis
12.17 Switzerland Ophthalmic Drugs Market Analysis
12.18 Rest of Europe Ophthalmic Drugs Market Analysis
13 Asia Pacific Ophthalmic Drugs Market Analysis
13.1 Key Findings
13.2 Asia Pacific Ophthalmic Drugs Market Attractiveness Index
13.3 Asia Pacific Ophthalmic Drugs Market by Country, 2026, 2031 & 2036 (US$ Billion)
13.4 Asia Pacific Ophthalmic Drugs Market Size Estimation and Forecast by Country
13.5 Asia Pacific Ophthalmic Drugs Market Size Estimation and Forecast by Indication
13.6 Asia Pacific Ophthalmic Drugs Market Size Estimation and Forecast by Type
13.7 Asia Pacific Ophthalmic Drugs Market Size Estimation and Forecast by Route of Administration
13.8 Asia Pacific Ophthalmic Drugs Market Size Estimation and Forecast by Distribution Channel
13.9 Asia Pacific Ophthalmic Drugs Market Size Estimation and Forecast by Drug Type
13.10 Asia Pacific Ophthalmic Drugs Market Size Estimation and Forecast by Drug Class
13.11 Japan Ophthalmic Drugs Market Analysis
13.12 China Ophthalmic Drugs Market Analysis
13.13 India Ophthalmic Drugs Market Analysis
13.14 Singapore Ophthalmic Drugs Market Analysis
13.15 Malaysia Ophthalmic Drugs Market Analysis
13.16 South Korea Ophthalmic Drugs Market Analysis
13.17 Australia Ophthalmic Drugs Market Analysis
13.18 Rest of Asia Pacific Ophthalmic Drugs Market Analysis
14 Latin America Ophthalmic Drugs Market Analysis
14.1 Key Findings
14.2 Latin America Ophthalmic Drugs Market Attractiveness Index
14.3 Latin America Ophthalmic Drugs Market by Country, 2026, 2031 & 2036 (US$ Billion)
14.4 Latin America Ophthalmic Drugs Market Size Estimation and Forecast by Country
14.5 Latin America Ophthalmic Drugs Market Size Estimation and Forecast by Indication
14.6 Latin America Ophthalmic Drugs Market Size Estimation and Forecast by Type
14.7 Latin America Ophthalmic Drugs Market Size Estimation and Forecast by Route of Administration
14.8 Latin America Ophthalmic Drugs Market Size Estimation and Forecast by Distribution Channel
14.9 Latin America Ophthalmic Drugs Market Size Estimation and Forecast by Drug Type
14.10 Latin America Ophthalmic Drugs Market Size Estimation and Forecast by Drug Class
14.11 Brazil Ophthalmic Drugs Market Analysis
14.12 Mexico Ophthalmic Drugs Market Analysis
14.13 Argentina Ophthalmic Drugs Market Analysis
14.14 Chile Ophthalmic Drugs Market Analysis
14.15 Rest of Latin America Ophthalmic Drugs Market Analysis
15 MEA Ophthalmic Drugs Market Analysis
15.1 Key Findings
15.2 MEA Ophthalmic Drugs Market Attractiveness Index
15.3 MEA Ophthalmic Drugs Market by Country, 2026, 2031 & 2036 (US$ Billion)
15.4 MEA Ophthalmic Drugs Market Size Estimation and Forecast by Country
15.5 MEA Ophthalmic Drugs Market Size Estimation and Forecast by Indication
15.6 MEA Ophthalmic Drugs Market Size Estimation and Forecast by Type
15.7 MEA Ophthalmic Drugs Market Size Estimation and Forecast by Route of Administration
15.8 MEA Ophthalmic Drugs Market Size Estimation and Forecast by Distribution Channel
15.9 MEA Ophthalmic Drugs Market Size Estimation and Forecast by Drug Type
15.10 MEA Ophthalmic Drugs Market Size Estimation and Forecast by Drug Class
15.11 GCC Ophthalmic Drugs Market Analysis
15.12 South Africa Ophthalmic Drugs Market Analysis
15.13 Rest of MEA Ophthalmic Drugs Market Analysis
16 Company Profiles
16.1 Strategic Outlook
16.2 Novartis AG
16.2.1 Company Snapshot
16.2.2 Company Overview
16.2.3 Financial Analysis
16.2.3.1 Net Revenue, 2020-2025
16.2.3.2 Regional Market Shares, 2025
16.2.3.3 Business Segment Market Shares, 2025
16.2.3.4 R&D Expense, 2020-2025
16.2.4 Product Benchmarking
16.2.5 Strategic Outlook
16.3 Bayer AG
16.3.1 Company Snapshot
16.3.2 Company Overview
16.3.3 Financial Analysis
16.3.3.1 Net Revenue, 2020-2024
16.3.3.2 Regional Market Shares, 2024
16.3.3.3 Business Segment Market Shares, 2024
16.3.3.4 R&D Expense, 2020-2024
16.3.4 Product Benchmarking
16.3.5 Strategic Outlook
16.4 Pfizer Inc.
16.4.1 Company Snapshot
16.4.2 Company Overview
16.4.3 Financial Analysis
16.4.3.1 Revenue, 2020-2024
16.4.3.2 R&D Expense, 2020-2024
16.4.3.3 Regional Market Shares, 2024
16.4.3.4 Business Segment Market Shares, 2024
16.4.4 Product Benchmarking
16.5 Bausch + Lomb Corporation
16.5.1 Company Snapshot
16.5.2 Company Overview
16.5.3 Financial Analysis
16.5.3.1 Revenue, 2020-2024
16.5.3.2 R&D Expense, 2020-2024
16.5.3.3 Business Segment Market Shares, 2024
16.5.4 Product Benchmarking
16.5.5 Strategic Outlook
16.6 Santen Pharmaceutical Co., Ltd.
16.6.1 Company Snapshot
16.6.2 Company Overview
16.6.3 Financial Analysis
16.6.3.1 Revenue, 2020-2025
16.6.3.2 Regional Market Shares, 2025
16.6.4 Product Benchmarking
16.6.5 Strategic Outlook
16.7 Johnson & Johnson Services, Inc.
16.7.1 Company Snapshot
16.7.2 Company Overview
16.7.3 Financial Analysis
16.7.3.1 Revenue, 2020-2025
16.7.3.2 Regional Market Shares, 2025
16.7.3.3 Business Segment Market Shares, 2025
16.7.3.4 R&D Expense, 2020-2025
16.7.4 Product Benchmarking
16.9 Regeneron Pharmaceuticals Inc.
16.9.1 Company Snapshot
16.9.2 Company Overview
16.9.3 Financial Analysis
16.9.3.1 Revenue, 2020-2025
16.9.3.2 R&D Expense, 2020-2025
16.9.4 Product Benchmarking
16.9.5 Strategic Outlook
16.10 AbbVie Inc.
16.10.1 Company Snapshot
16.10.2 Company Overview
16.10.3 Financial Analysis
16.10.3.1 Revenue, 2020-2025
16.10.3.2 Regional Market Shares, 2025
16.10.3.3 Business Segment Market Shares, 2025
16.10.3.4 R&D Expense, 2020-2025
16.10.4 Product Benchmarking
16.10.5 Strategic Outlook
16.11 F. Hoffmann-La Roche Ltd
16.11.1 Company Snapshot
16.11.2 Company Overview
16.11.3 Financial Analysis
16.11.3.1 Revenue, 2020-2024
16.11.3.2 Business Segment Market Shares, 2024
16.11.3.3 R&D Expense, 2020-2024
16.11.4 Product Benchmarking
16.11.5 Strategic Outlook
16.12 Teva Pharmaceutical Industries Ltd.
16.12.1 Company Snapshot
16.12.2 Company Overview
16.12.3 Financial Analysis
16.12.3.1 Revenue, 2020-2025
16.12.3.2 Regional Market Shares, 2025
16.12.3.3 R&D Expense, 2020-2025
16.12.4 Product Benchmarking
16.12.5 Strategic Outlook
16.13 Apellis Pharmaceuticals
16.13.1 Company Snapshot
16.13.2 Company Overview
16.13.3 Financial Analysis
16.13.3.1 Revenue, 2020-2024
16.13.4 Product Benchmarking
16.14 Novaliq GmbH
16.14.1 Company Snapshot
16.14.2 Company Overview
16.14.3 Product Benchmarking
16.14.4 Strategic Outlook
16.15 EyeBio
16.15.1 Company Snapshot
16.15.2 Company Overview
16.15.3 Product Benchmarking
16.15.4 Strategic Outlook
16.17 SpliceBio
16.17.1 Company Snapshot
16.17.2 Company Overview
16.17.3 Product Benchmarking
16.17.4 Strategic Outlook
16.18 Breye Therapeutics ApS
16.18.1 Company Snapshot
16.18.2 Company Overview
16.18.3 Product Benchmarking
16.18.4 Strategic Outlook
16.19 Nicox
16.19.1 Company Snapshot
16.19.2 Company Overview
16.19.3 Financial Analysis
16.19.3.1 Net Revenue, 2020-2024
16.19.5 Product Benchmarking
16.19.6 Strategic Outlook
16.20 Alcon
16.20.1 Company Snapshot
16.20.2 Company Overview
16.20.3 Financial Analysis
16.20.3.1 Net Revenue, 2020-2024
16.20.3.2 Business Segment Market Shares, 2024
16.20.3.3 Regional Market Shares, 2024
16.20.3.4 R&D Expense, 2020-2024
16.20.4 Product Benchmarking
16.20.5 Strategic Outlook
16.21 Viatris Inc.
16.21.1 Company Snapshot
16.21.2 Company Overview
16.21.3 Financial Analysis
16.21.3.1 Net Revenue, 2020-2024
16.21.3.2 Regional Market Shares, 2024
16.21.3.3 R&D Expense, 2020-2024
16.21.4 Product Benchmarking
16.21.5 Strategic Outlook
16.22 Sun Pharmaceutical Industries Ltd.
16.22.1 Company Snapshot
16.22.2 Company Overview
16.22.3 Financial Analysis
16.22.3.1 Net Revenue, 2020-2025
16.22.3.2 R&D Expense, 2020-2025
16.22.4 Product Benchmarking
17 Conclusion and Recommendations
17.1 Concluding Remarks from Visiongain
17.2 Recommendations for Market Players
ページTOPに戻る
List of Tables/Graphs
List of Tables
Table 1 Ophthalmic Drugs Market Snapshot, 2026 & 2036 (US$ Billion, CAGR %)
Table 2 Ophthalmic Drugs Market: Product Pipeline
Table 3 Ophthalmic Drugs Market Forecast by Region, 2026-2036 (US$ Billion, AGR%, CAGR%): “V” Shaped Recovery
Table 4 Ophthalmic Drugs Market Forecast by Region, 2026-2036 (US$ Billion, AGR%, CAGR%): “U” Shaped Recovery
Table 5 Ophthalmic Drugs Market Forecast by Region, 2026-2036 (US$ Billion, AGR%, CAGR%): “L” Shaped Recovery
Table 6 Ophthalmic Drugs Market Forecast by Indication, 2026-2036 (US$ Billion, AGR %, CAGR %)
Table 7 Retinal Disorders Segment Market Forecast by Region, 2026-2036 (US$ Billion, AGR%, CAGR%)
Table 8 Retinal Disorders Segment by Type Forecast, 2026-2036 (US$ Million, AGR %, CAGR %)
Table 9 Infection/Inflammation/Allergy Segment Market Forecast by Region, 2026-2036 (US$ Billion, AGR%, CAGR%)
Table 10 Glaucoma Segment Market Forecast by Region, 2026-2036 (US$ Billion, AGR%, CAGR%)
Table 11 Dry Eye Segment Market Forecast by Region, 2026-2036 (US$ Billion, AGR%, CAGR%)
Table 12 Others Segment Market Forecast by Region, 2026-2036 (US$ Billion, AGR%, CAGR%)
Table 13 Ophthalmic Drugs Market Forecast by Type, 2026-2036 (US$ Billion, AGR %, CAGR %)
Table 14 Prescription Drugs Segment Market Forecast by Region, 2026-2036 (US$ Billion, AGR%, CAGR%)
Table 15 OTC Drugs Segment Market Forecast by Region, 2026-2036 (US$ Billion, AGR%, CAGR%)
Table 16 Ophthalmic Drugs Market Forecast by Route of Administration, 2026-2036 (US$ Billion, AGR %, CAGR %)
Table 17 Topical Segment Market Forecast by Region, 2026-2036 (US$ Billion, AGR%, CAGR%)
Table 18 Parenteral Segment Market Forecast by Region, 2026-2036 (US$ Billion, AGR%, CAGR%)
Table 19 Ophthalmic Drugs Market Forecast by Distribution Channel, 2026-2036 (US$ Billion, AGR %, CAGR %)
Table 20 Hospital Pharmacies Segment Market Forecast by Region, 2026-2036 (US$ Billion, AGR%, CAGR%)
Table 21 Drug Stores Segment Market Forecast by Region, 2026-2036 (US$ Billion, AGR%, CAGR%)
Table 22 Online Pharmacies Segment Market Forecast by Region, 2026-2036 (US$ Billion, AGR%, CAGR%)
Table 23 Ophthalmic Drugs Market Forecast by Drug Type, 2026-2036 (US$ Billion, AGR %, CAGR %)
Table 24 Branded Drugs Segment Market Forecast by Region, 2026-2036 (US$ Billion, AGR%, CAGR%)
Table 25 Generic Drugs Segment Market Forecast by Region, 2026-2036 (US$ Billion, AGR%, CAGR%)
Table 26 Ophthalmic Drugs Market Forecast by Drug Class, 2026-2036 (US$ Billion, AGR %, CAGR %)
Table 27 Anti-VEGF Agents Segment Market Forecast by Region, 2026-2036 (US$ Billion, AGR%, CAGR%)
Table 28 Anti-Glaucoma Drugs Segment Market Forecast by Region, 2026-2036 (US$ Billion, AGR%, CAGR%)
Table 29 Anti-Inflammatory & Anti-Infective Drugs Segment Market Forecast by Region, 2026-2036 (US$ Billion, AGR%, CAGR%)
Table 30 Anti-Allergy Drugs Segment Market Forecast by Region, 2026-2036 (US$ Billion, AGR%, CAGR%)
Table 31 Others Segment Market Forecast by Region, 2026-2036 (US$ Billion, AGR%, CAGR%)
Table 32 Ophthalmic Drugs Market Forecast by Region, 2026-2036 (US$ Billion, AGR%, CAGR%)
Table 33 North America Ophthalmic Drugs Market Forecast by Country, 2026-2036 (US$ Billion, AGR%, CAGR%)
Table 34 North America Ophthalmic Drugs Market Forecast by Indication, 2026-2036 (US$ Billion, AGR %, CAGR %)
Table 35 North America Ophthalmic Drugs Market Forecast by Type, 2026-2036 (US$ Billion, AGR %, CAGR %)
Table 36 North America Ophthalmic Drugs Market Forecast by Route of Administration, 2026-2036 (US$ Billion, AGR %, CAGR %)
Table 37 North America Ophthalmic Drugs Market Forecast by Distribution Channel, 2026-2036 (US$ Billion, AGR %, CAGR %)
Table 38 North America Ophthalmic Drugs Market Forecast by Drug Type, 2026-2036 (US$ Billion, AGR %, CAGR %)
Table 39 North America Ophthalmic Drugs Market Forecast by Drug Class, 2026-2036 (US$ Billion, AGR %, CAGR %)
Table 40 U.S. Ophthalmic Drugs Market Forecast, 2026-2036 (US$ Billion, AGR%, CAGR%)
Table 41 Canada Ophthalmic Drugs Market Forecast, 2026-2036 (US$ Billion, AGR%, CAGR%)
Table 42 Europe Ophthalmic Drugs Market Forecast by Country, 2026-2036 (US$ Billion, AGR%, CAGR%)
Table 43 Europe Ophthalmic Drugs Market Forecast by Indication, 2026-2036 (US$ Billion, AGR %, CAGR %)
Table 44 Europe Ophthalmic Drugs Market Forecast by Type, 2026-2036 (US$ Billion, AGR %, CAGR %)
Table 45 Europe Ophthalmic Drugs Market Forecast by Route of Administration, 2026-2036 (US$ Billion, AGR %, CAGR %)
Table 46 Europe Ophthalmic Drugs Market Forecast by Distribution Channel, 2026-2036 (US$ Billion, AGR %, CAGR %)
Table 47 Europe Ophthalmic Drugs Market Forecast by Drug Type, 2026-2036 (US$ Billion, AGR %, CAGR %)
Table 48 Europe Ophthalmic Drugs Market Forecast by Drug Class, 2026-2036 (US$ Billion, AGR %, CAGR %)
Table 49 Germany Ophthalmic Drugs Market Forecast, 2026-2036 (US$ Billion, AGR%, CAGR%)
Table 50 UK Ophthalmic Drugs Market Forecast, 2026-2036 (US$ Billion, AGR%, CAGR%)
Table 51 Italy Ophthalmic Drugs Market Forecast, 2026-2036 (US$ Billion, AGR%, CAGR%)
Table 52 Spain Ophthalmic Drugs Market Forecast, 2026-2036 (US$ Billion, AGR%, CAGR%)
Table 53 The Netherlands Ophthalmic Drugs Market Forecast, 2026-2036 (US$ Billion, AGR%, CAGR%)
Table 54 Switzerland Ophthalmic Drugs Market Forecast, 2026-2036 (US$ Billion, AGR%, CAGR%)
Table 55 Rest of Europe Ophthalmic Drugs Market Forecast, 2026-2036 (US$ Billion, AGR%, CAGR%)
Table 56 Asia Pacific Ophthalmic Drugs Market Forecast by Country, 2026-2036 (US$ Billion, AGR%, CAGR%)
Table 57 Asia Pacific Ophthalmic Drugs Market Forecast by Indication, 2026-2036 (US$ Billion, AGR %, CAGR %)
Table 58 Asia Pacific Ophthalmic Drugs Market Forecast by Type, 2026-2036 (US$ Billion, AGR %, CAGR %)
Table 59 Asia Pacific Ophthalmic Drugs Market Forecast by Route of Administration, 2026-2036 (US$ Billion, AGR %, CAGR %)
Table 60 Asia Pacific Ophthalmic Drugs Market Forecast by Distribution Channel, 2026-2036 (US$ Billion, AGR %, CAGR %)
Table 61 Asia Pacific Ophthalmic Drugs Market Forecast by Drug Type, 2026-2036 (US$ Billion, AGR %, CAGR %)
Table 62 Asia Pacific Ophthalmic Drugs Market Forecast by Drug Class, 2026-2036 (US$ Billion, AGR %, CAGR %)
Table 63 Japan Ophthalmic Drugs Market Forecast, 2026-2036 (US$ Billion, AGR%, CAGR%)
Table 64 China Ophthalmic Drugs Market Forecast, 2026-2036 (US$ Billion, AGR%, CAGR%)
Table 65 India Ophthalmic Drugs Market Forecast, 2026-2036 (US$ Billion, AGR%, CAGR%)
Table 66 Singapore Ophthalmic Drugs Market Forecast, 2026-2036 (US$ Billion, AGR%, CAGR%)
Table 67 Malaysia Ophthalmic Drugs Market Forecast, 2026-2036 (US$ Billion, AGR%, CAGR%)
Table 68 South Korea Ophthalmic Drugs Market Forecast, 2026-2036 (US$ Billion, AGR%, CAGR%)
Table 69 Australia Ophthalmic Drugs Market Forecast, 2026-2036 (US$ Billion, AGR%, CAGR%)
Table 70 Rest of Asia Pacific Ophthalmic Drugs Market Forecast, 2026-2036 (US$ Billion, AGR%, CAGR%)
Table 71 Latin America Ophthalmic Drugs Market Forecast by Country, 2026-2036 (US$ Billion, AGR%, CAGR%)
Table 72 Latin America Ophthalmic Drugs Market Forecast by Indication, 2026-2036 (US$ Billion, AGR %, CAGR %)
Table 73 Latin America Ophthalmic Drugs Market Forecast by Type, 2026-2036 (US$ Billion, AGR %, CAGR %)
Table 74 Latin America Ophthalmic Drugs Market Forecast by Route of Administration, 2026-2036 (US$ Billion, AGR %, CAGR %)
Table 75 Latin America Ophthalmic Drugs Market Forecast by Distribution Channel, 2026-2036 (US$ Billion, AGR %, CAGR %)
Table 76 Latin America Ophthalmic Drugs Market Forecast by Drug Type, 2026-2036 (US$ Billion, AGR %, CAGR %)
Table 77 Latin America Ophthalmic Drugs Market Forecast by Drug Class, 2026-2036 (US$ Billion, AGR %, CAGR %)
Table 78 Brazil Ophthalmic Drugs Market Forecast, 2026-2036 (US$ Billion, AGR%, CAGR%)
Table 79 Mexico Ophthalmic Drugs Market Forecast, 2026-2036 (US$ Billion, AGR%, CAGR%)
Table 80 Argentina Ophthalmic Drugs Market Forecast, 2026-2036 (US$ Billion, AGR%, CAGR%)
Table 81 Chile Ophthalmic Drugs Market Forecast, 2026-2036 (US$ Billion, AGR%, CAGR%)
Table 82 Rest of Latin America Ophthalmic Drugs Market Forecast, 2026-2036 (US$ Billion, AGR%, CAGR%)
Table 83 MEA Ophthalmic Drugs Market Forecast by Country, 2026-2036 (US$ Billion, AGR%, CAGR%)
Table 84 MEA Ophthalmic Drugs Market Forecast by Indication, 2026-2036 (US$ Billion, AGR %, CAGR %)
Table 85 MEA Ophthalmic Drugs Market Forecast by Type, 2026-2036 (US$ Billion, AGR %, CAGR %)
Table 86 MEA Ophthalmic Drugs Market Forecast by Route of Administration, 2026-2036 (US$ Billion, AGR %, CAGR %)
Table 87 MEA Ophthalmic Drugs Market Forecast by Distribution Channel, 2026-2036 (US$ Billion, AGR %, CAGR %)
Table 88 MEA Ophthalmic Drugs Market Forecast by Drug Type, 2026-2036 (US$ Billion, AGR %, CAGR %)
Table 89 MEA Ophthalmic Drugs Market Forecast by Drug Class, 2026-2036 (US$ Billion, AGR %, CAGR %)
Table 90 GCC Ophthalmic Drugs Market Forecast, 2026-2036 (US$ Billion, AGR%, CAGR%)
Table 91 South Africa Ophthalmic Drugs Market Forecast, 2026-2036 (US$ Billion, AGR%, CAGR%)
Table 92 Rest of MEA Ophthalmic Drugs Market Forecast, 2026-2036 (US$ Billion, AGR%, CAGR%)
Table 93 Strategic Outlook
Table 94 Novartis AG: Key Details, (CEO, HQ, Revenue, Founded, No. of Employees, Company Type, Website, Business Segment)
Table 95 Novartis AG: Product Benchmarking
Table 96 Novartis AG: Strategic Outlook
Table 97 Bayer AG: Key Details, (CEO, HQ, Revenue, Founded, No. of Employees, Company Type, Website, Business Segment)
Table 98 Bayer AG: Product Benchmarking
Table 99 Bayer AG: Strategic Outlook
Table 100 Pfizer Inc.: Key Details, (CEO, HQ, Revenue, Founded, No. of Employees, Company Type, Website, Business Segment)
Table 101 Pfizer Inc.: Product Benchmarking
Table 102 Bausch + Lomb Corporation: Key Details, (CEO, HQ, Revenue, Founded, No. of Employees, Company Type, Website, Business Segment)
Table 103 Bausch + Lomb Corporation: Product Benchmarking
Table 104 Bausch + Lomb Corporation: Strategic Outlook
Table 105 Santen Pharmaceutical Co., Ltd.: Key Details, (CEO, HQ, Revenue, Founded, No. of Employees, Company Type, Website, Business Segment)
Table 106 Santen Pharmaceutical Co., Ltd.: Product Benchmarking
Table 107 Santen Pharmaceutical Co., Ltd.: Strategic Outlook
Table 108 Johnson & Johnson Services Inc: Key Details, (CEO, HQ, Revenue, Founded, No. of Employees, Company Type, Website, Business Segment)
Table 109 Johnson & Johnson Private Limited: Product Benchmarking
Table 110 Regeneron Pharmaceuticals Inc.: Key Details, (CEO, HQ, Revenue, Founded, No. of Employees, Company Type, Website, Business Segment)
Table 111 Regeneron Pharmaceuticals Inc.: Product Benchmarking
Table 112 Regeneron Pharmaceuticals Inc.: Strategic Outlook
Table 113 AbbVie Inc.: Key Details, (CEO, HQ, Revenue, Founded, No. of Employees, Company Type, Website, Business Segment)
Table 114 AbbVie Inc.: Product Benchmarking
Table 115 AbbVie Inc.: Strategic Outlook
Table 116 F. Hoffmann-La Roche Ltd: Key Details, (CEO, HQ, Revenue, Founded, No. of Employees, Company Type, Website, Business Segment)
Table 117 F. Hoffmann-La Roche Ltd: Product Benchmarking
Table 118 F. Hoffmann-La Roche Ltd: Strategic Outlook
Table 119 Teva Pharmaceutical Industries Ltd.: Key Details, (CEO, HQ, Revenue, Founded, No. of Employees, Company Type, Website, Business Segment)
Table 120 Teva Pharmaceutical Industries Ltd.: Product Benchmarking
Table 121 Teva Pharmaceutical Industries Ltd.: Strategic Outlook
Table 122 Apellis Pharmaceuticals: Key Details, (CEO, HQ, Revenue, Founded, No. of Employees, Company Type, Website, Business Segment)
Table 123 Apellis Pharmaceuticals: Product Benchmarking
Table 124 Novaliq GmbH: Key Details, (CEO, HQ, Revenue, Founded, No. of Employees, Company Type, Website, Business Segment)
Table 125 Novaliq GmbH.: Product Benchmarking
Table 126 Novaliq GmbH: Strategic Outlook
Table 127 EyeBio: Key Details, (CEO, HQ, Revenue, Founded, No. of Employees, Company Type, Website, Business Segment)
Table 128 EyeBio: Product Benchmarking
Table 129 EyeBio: Strategic Outlook
Table 130 SpliceBio: Key Details, (CEO, HQ, Revenue, Founded, No. of Employees, Company Type, Website, Business Segment)
Table 131 SpliceBio: Product Benchmarking
Table 132 SpliceBio: Strategic Outlook
Table 133 Breye Therapeutics ApS: Key Details, (CEO, HQ, Revenue, Founded, No. of Employees, Company Type, Website, Business Segment)
Table 134 Breye Therapeutics ApS: Product Benchmarking
Table 135 Breye Therapeutics ApS: Strategic Outlook
Table 136 Nicox: Key Details, (CEO, HQ, Revenue, Founded, No. of Employees, Company Type, Website, Business Segment)
Table 137 Nicox: Product Benchmarking
Table 138 Nicox: Strategic Outlook
Table 139 Alcon: Key Details, (CEO, HQ, Revenue, Founded, No. of Employees, Company Type, Website, Business Segment)
Table 140 Alcon: Product Benchmarking
Table 141 Alcon: Strategic Outlook
Table 142 Viatris Inc.: Key Details, (CEO, HQ, Revenue, Founded, No. of Employees, Company Type, Website, Business Segment)
Table 143 Viatris Inc.: Product Benchmarking
Table 144 Viatris Inc.: Strategic Outlook
Table 145 Sun Pharmaceutical Industries Ltd.: Key Details, (CEO, HQ, Revenue, Founded, No. of Employees, Company Type, Website, Business Segment)
Table 146 Sun Pharmaceutical Industries Ltd.: Product Benchmarking
List of Figures
Figure 1 Ophthalmic Drugs Market Segmentation
Figure 2 Ophthalmic Drugs Market by Indication: Market Attractiveness Index
Figure 3 Ophthalmic Drugs Market by Type: Market Attractiveness Index
Figure 4 Ophthalmic Drugs Market by Route of Administration: Market Attractiveness Index
Figure 5 Ophthalmic Drugs Market by Distribution Channel: Market Attractiveness Index
Figure 6 Ophthalmic Drugs Market by Drug Type: Market Attractiveness Index
Figure 7 Ophthalmic Drugs Market by Drug Class: Market Attractiveness Index
Figure 8 Ophthalmic Drugs Market Attractiveness Index by Region
Figure 9 Ophthalmic Drugs Market: Market Dynamics
Figure 10 Ophthalmic Drugs Market: Impact Analysis
Figure 11 Ophthalmic Drugs Market by Region, 2026-2036 (US$ Billion, AGR %), Tariff Impact: V-Shaped Recovery Scenario
Figure 12 Ophthalmic Drugs Market by Region, 2026-2036 (US$ Billion, AGR %), Tariff Impact: U-Shaped Recovery Scenario
Figure 13 Ophthalmic Drugs Market by Region, 2026-2036 (US$ Billion, AGR %), Tariff Impact: L-Shaped Recovery Scenario
Figure 14 Short Term & Long-Term Planning
Figure 15 Impact of U.S. and China Trade War
Figure 16 Most Impacted Countries
Figure 17 Ophthalmic Drugs Market: Porter’s Five Forces Analysis
Figure 18 Ophthalmic Drugs Market: PEST Analysis
Figure 19 Ophthalmic Drugs Market Attractiveness Index by Indication
Figure 20 Ophthalmic Drugs Market Forecast by Indication, 2026-2036 (US$ Billion, AGR %)
Figure 21 Ophthalmic Drugs Market Share Forecast by Indication, 2026, 2031, 2036 (%)
Figure 22 Retinal Disorders Segment Market Forecast by Region, 2026-2036 (US$ Billion, AGR %)
Figure 23 Retinal Disorders Segment Market Share Forecast by Region, 2026 & 2036 (%)
Figure 24 Retinal Disorders Segment Market Forecast by Type, 2026-2036 (US$ Billion, AGR %)
Figure 25 Infection/Inflammation/Allergy Segment Market Forecast by Region, 2026-2036 (US$ Billion, AGR %)
Figure 26 Infection/Inflammation/Allergy Segment Market Share Forecast by Region, 2026 & 2036 (%)
Figure 27 Glaucoma Segment Market Forecast by Region, 2026-2036 (US$ Billion, AGR %)
Figure 28 Glaucoma Segment Market Share Forecast by Region, 2026 & 2036 (%)
Figure 29 Dry Eye Segment Market Forecast by Region, 2026-2036 (US$ Billion, AGR %)
Figure 30 Dry Eye Segment Market Share Forecast by Region, 2026 & 2036 (%)
Figure 31 Others Segment Market Forecast by Region, 2026-2036 (US$ Billion, AGR %)
Figure 32 Others Segment Market Share Forecast by Region, 2026 & 2036 (%)
Figure 33 Ophthalmic Drugs Market Attractiveness Index by Indication
Figure 34 Ophthalmic Drugs Market Forecast by Type, 2026-2036 (US$ Billion, AGR %)
Figure 35 Ophthalmic Drugs Market Share Forecast by Type, 2026, 2031, 2036 (%)
Figure 36 Prescription Drugs Segment Market Forecast by Region, 2026-2036 (US$ Billion, AGR %)
Figure 37 Prescription Drugs Segment Market Share Forecast by Region, 2026 & 2036 (%)
Figure 38 OTC Drugs Segment Market Forecast by Region, 2026-2036 (US$ Billion, AGR %)
Figure 39 OTC Drugs Segment Market Share Forecast by Region, 2026 & 2036 (%)
Figure 40 Ophthalmic Drugs Market Attractiveness Index by Route of Administration
Figure 41 Ophthalmic Drugs Market Forecast by Route of Administration, 2026-2036 (US$ Billion, AGR %)
Figure 42 Ophthalmic Drugs Market Share Forecast by Route of Administration, 2026, 2031, 2036 (%)
Figure 43 Topical Segment Market Forecast by Region, 2026-2036 (US$ Billion, AGR %)
Figure 44 Topical Segment Market Share Forecast by Region, 2026 & 2036 (%)
Figure 45 Parenteral Segment Market Forecast by Region, 2026-2036 (US$ Billion, AGR %)
Figure 46 Parenteral Segment Market Share Forecast by Region, 2026 & 2036 (%)
Figure 47 Ophthalmic Drugs Market Attractiveness Index by Distribution Channel
Figure 48 Ophthalmic Drugs Market Forecast by Distribution Channel, 2026-2036 (US$ Billion, AGR %)
Figure 49 Ophthalmic Drugs Market Share Forecast by Distribution Channel, 2026, 2031, 2036 (%)
Figure 50 Hospital Pharmacies Segment Market Forecast by Region, 2026-2036 (US$ Billion, AGR %)
Figure 51 Hospital Pharmacies Segment Market Share Forecast by Region, 2026 & 2036 (%)
Figure 52 Drug Stores Segment Market Forecast by Region, 2026-2036 (US$ Billion, AGR %)
Figure 53 Drug Stores Segment Market Share Forecast by Region, 2026 & 2036 (%)
Figure 54 Online Pharmacies Segment Market Forecast by Region, 2026-2036 (US$ Billion, AGR %)
Figure 55 Online Pharmacies Segment Market Share Forecast by Region, 2026 & 2036 (%)
Figure 56 Ophthalmic Drugs Market Attractiveness Index by Drug Type
Figure 57 Ophthalmic Drugs Market Forecast by Drug Type, 2026-2036 (US$ Billion, AGR %)
Figure 58 Ophthalmic Drugs Market Share Forecast by Drug Type, 2026, 2031, 2036 (%)
Figure 59 Branded Drugs Segment Market Forecast by Region, 2026-2036 (US$ Billion, AGR %)
Figure 60 Branded Drugs Segment Market Share Forecast by Region, 2026 & 2036 (%)
Figure 61 Generic Drugs Segment Market Forecast by Region, 2026-2036 (US$ Billion, AGR %)
Figure 62 Generic Drugs Segment Market Share Forecast by Region, 2026 & 2036 (%)
Figure 63 Ophthalmic Drugs Market Attractiveness Index by Drug Class
Figure 64 Ophthalmic Drugs Market Forecast by Drug Class, 2026-2036 (US$ Billion, AGR %)
Figure 65 Ophthalmic Drugs Market Share Forecast by Drug Class, 2026, 2031, 2036 (%)
Figure 66 Anti-VEGF Agents Segment Market Forecast by Region, 2026-2036 (US$ Billion, AGR %)
Figure 67 Anti-VEGF Agents Segment Market Share Forecast by Region, 2026 & 2036 (%)
Figure 68 Anti-Glaucoma Drugs Segment Market Forecast by Region, 2026-2036 (US$ Billion, AGR %)
Figure 69 Anti-Glaucoma Drugs Segment Market Share Forecast by Region, 2026 & 2036 (%)
Figure 70 Anti-Inflammatory & Anti-Infective Drugs Segment Market Forecast by Region, 2026-2036 (US$ Billion, AGR %)
Figure 71 Anti-Inflammatory & Anti-Infective Drugs Segment Market Share Forecast by Region, 2026 & 2036 (%)
Figure 72 Anti-Allergy Drugs Segment Market Forecast by Region, 2026-2036 (US$ Billion, AGR %)
Figure 73 Anti-Allergy Drugs Segment Market Share Forecast by Region, 2026 & 2036 (%)
Figure 74 Others Segment Market Forecast by Region, 2026-2036 (US$ Billion, AGR %)
Figure 75 Others Segment Market Share Forecast by Region, 2026 & 2036 (%)
Figure 76 Ophthalmic Drugs Market Forecast by Region 2026, 2031, 2036 (Revenue, CAGR%)
Figure 77 Ophthalmic Drugs Market Share Forecast by Region 2026, 2031, 2036 (%)
Figure 78 Ophthalmic Drugs Market by Region, 2026-2036 (US$ Billion, AGR %)
Figure 79 North America Ophthalmic Drugs Market Attractiveness Index
Figure 80 North America Ophthalmic Drugs Market by Region, 2026, 2031 & 2036 (US$ Billion)
Figure 81 North America Ophthalmic Drugs Market Forecast by Country, 2026-2036 (US$ Billion, AGR %)
Figure 82 North America Ophthalmic Drugs Market Share Forecast by Country, 2026 & 2036 (%)
Figure 83 North America Ophthalmic Drugs Market Forecast by Indication, 2026-2036 (US$ Billion, AGR %)
Figure 84 North America Ophthalmic Drugs Market Share Forecast by Indication, 2026 & 2036 (%)
Figure 85 North America Ophthalmic Drugs Market Forecast by Type, 2026-2036 (US$ Billion, AGR %)
Figure 86 North America Ophthalmic Drugs Market Share Forecast by Type, 2026 & 2036 (%)
Figure 87 North America Ophthalmic Drugs Market Forecast by Route of Administration, 2026-2036 (US$ Billion, AGR %)
Figure 88 North America Ophthalmic Drugs Market Share Forecast by Route of Administration, 2026 & 2036 (%)
Figure 89 North America Ophthalmic Drugs Market Forecast by Distribution Channel, 2026-2036 (US$ Billion, AGR %)
Figure 90 North America Ophthalmic Drugs Market Share Forecast by Distribution Channel, 2026 & 2036 (%)
Figure 91 North America Ophthalmic Drugs Market Forecast by Drug Type, 2026-2036 (US$ Billion, AGR %)
Figure 92 North America Ophthalmic Drugs Market Share Forecast by Drug Type, 2026 & 2036 (%)
Figure 93 North America Ophthalmic Drugs Market Forecast by Drug Class, 2026-2036 (US$ Billion, AGR %)
Figure 94 North America Ophthalmic Drugs Market Share Forecast by Drug Class, 2026 & 2036 (%)
Figure 95 U.S. Ophthalmic Drugs Market Forecast, 2026-2036 (US$ Billion, AGR %)
Figure 96 Canada Ophthalmic Drugs Market Forecast, 2026-2036 (US$ Billion, AGR %)
Figure 97 Europe Ophthalmic Drugs Market Attractiveness Index
Figure 98 Europe Ophthalmic Drugs Market by Region, 2026, 2031 & 2036 (US$ Billion)
Figure 99 Europe Ophthalmic Drugs Market Forecast by Country, 2026-2036 (US$ Billion, AGR %)
Figure 100 Europe Ophthalmic Drugs Market Share Forecast by Country, 2026 & 2036 (%)
Figure 101 Europe Ophthalmic Drugs Market Forecast by Indication, 2026-2036 (US$ Billion, AGR %)
Figure 102 Europe Ophthalmic Drugs Market Share Forecast by Indication, 2026 & 2036 (%)
Figure 103 Europe Ophthalmic Drugs Market Forecast by Type, 2026-2036 (US$ Billion, AGR %)
Figure 104 Europe Ophthalmic Drugs Market Share Forecast by Type, 2026 & 2036 (%)
Figure 105 Europe Ophthalmic Drugs Market Forecast by Route of Administration, 2026-2036 (US$ Billion, AGR %)
Figure 106 Europe Ophthalmic Drugs Market Share Forecast by Route of Administration, 2026 & 2036 (%)
Figure 107 Europe Ophthalmic Drugs Market Forecast by Distribution Channel, 2026-2036 (US$ Billion, AGR %)
Figure 108 Europe Ophthalmic Drugs Market Share Forecast by Distribution Channel, 2026 & 2036 (%)
Figure 109 Europe Ophthalmic Drugs Market Forecast by Drug Type, 2026-2036 (US$ Billion, AGR %)
Figure 110 Europe Ophthalmic Drugs Market Share Forecast by Drug Type, 2026 & 2036 (%)
Figure 111 Europe Ophthalmic Drugs Market Forecast by Drug Class, 2026-2036 (US$ Billion, AGR %)
Figure 112 Europe Ophthalmic Drugs Market Share Forecast by Drug Class, 2026 & 2036 (%)
Figure 113 Germany Ophthalmic Drugs Market Forecast, 2026-2036 (US$ Billion, AGR %)
Figure 114 UK Ophthalmic Drugs Market Forecast, 2026-2036 (US$ Billion, AGR %)
Figure 115 France Ophthalmic Drugs Market Forecast, 2026-2036 (US$ Billion, AGR %)
Figure 116 Italy Ophthalmic Drugs Market Forecast, 2026-2036 (US$ Billion, AGR %)
Figure 117 Spain Ophthalmic Drugs Market Forecast, 2026-2036 (US$ Billion, AGR %)
Figure 118 The Netherlands Ophthalmic Drugs Market Forecast, 2026-2036 (US$ Billion, AGR %)
Figure 119 Switzerland Ophthalmic Drugs Market Forecast, 2026-2036 (US$ Billion, AGR %)
Figure 120 Rest of Europe Ophthalmic Drugs Market Forecast, 2026-2036 (US$ Billion, AGR %)
Figure 121 Asia Pacific Ophthalmic Drugs Market Attractiveness Index
Figure 122 Asia Pacific Ophthalmic Drugs Market by Region, 2026, 2031 & 2036 (US$ Billion)
Figure 123 Asia Pacific Ophthalmic Drugs Market Forecast by Country, 2026-2036 (US$ Billion, AGR %)
Figure 124 Asia Pacific Ophthalmic Drugs Market Share Forecast by Country, 2026 & 2036 (%)
Figure 125 Asia Pacific Ophthalmic Drugs Market Forecast by Indication, 2026-2036 (US$ Billion, AGR %)
Figure 126 Asia Pacific Ophthalmic Drugs Market Share Forecast by Indication, 2026 & 2036 (%)
Figure 127 Asia Pacific Ophthalmic Drugs Market Forecast by Type, 2026-2036 (US$ Billion, AGR %)
Figure 128 Asia Pacific Ophthalmic Drugs Market Share Forecast by Type, 2026 & 2036 (%)
Figure 129 Asia Pacific Ophthalmic Drugs Market Forecast by Route of Administration, 2026-2036 (US$ Billion, AGR %)
Figure 130 Asia Pacific Ophthalmic Drugs Market Share Forecast by Route of Administration, 2026 & 2036 (%)
Figure 131 Asia Pacific Ophthalmic Drugs Market Forecast by Distribution Channel, 2026-2036 (US$ Billion, AGR %)
Figure 132 Asia Pacific Ophthalmic Drugs Market Share Forecast by Distribution Channel, 2026 & 2036 (%)
Figure 133 Asia Pacific Ophthalmic Drugs Market Forecast by Drug Type, 2026-2036 (US$ Billion, AGR %)
Figure 134 Asia Pacific Ophthalmic Drugs Market Share Forecast by Drug Type, 2026 & 2036 (%)
Figure 135 Asia Pacific Ophthalmic Drugs Market Forecast by Drug Class, 2026-2036 (US$ Billion, AGR %)
Figure 136 Asia Pacific Ophthalmic Drugs Market Share Forecast by Drug Class, 2026 & 2036 (%)
Figure 137 Japan Ophthalmic Drugs Market Forecast, 2026-2036 (US$ Billion, AGR %)
Figure 138 China Ophthalmic Drugs Market Forecast, 2026-2036 (US$ Billion, AGR %)
Figure 139 India Ophthalmic Drugs Market Forecast, 2026-2036 (US$ Billion, AGR %)
Figure 140 Singapore Ophthalmic Drugs Market Forecast, 2026-2036 (US$ Billion, AGR %)
Figure 141 Malaysia Ophthalmic Drugs Market Forecast, 2026-2036 (US$ Billion, AGR %)
Figure 142 South Korea Ophthalmic Drugs Market Forecast, 2026-2036 (US$ Billion, AGR %)
Figure 143 Australia Ophthalmic Drugs Market Forecast, 2026-2036 (US$ Billion, AGR %)
Figure 144 Rest of Asia Pacific Ophthalmic Drugs Market Forecast, 2026-2036 (US$ Billion, AGR %)
Figure 145 Latin America Ophthalmic Drugs Market Attractiveness Index
Figure 146 Latin America Ophthalmic Drugs Market by Region, 2026, 2031 & 2036 (US$ Billion)
Figure 147 Latin America Ophthalmic Drugs Market Forecast by Country, 2026-2036 (US$ Billion, AGR %)
Figure 148 Latin America Ophthalmic Drugs Market Share Forecast by Country, 2026 & 2036 (%)
Figure 149 Latin America Ophthalmic Drugs Market Forecast by Indication, 2026-2036 (US$ Billion, AGR %)
Figure 150 Latin America Ophthalmic Drugs Market Share Forecast by Indication, 2026 & 2036 (%)
Figure 151 Latin America Ophthalmic Drugs Market Forecast by Type, 2026-2036 (US$ Billion, AGR %)
Figure 152 Latin America Ophthalmic Drugs Market Share Forecast by Type, 2026 & 2036 (%)
Figure 153 Latin America Ophthalmic Drugs Market Forecast by Route of Administration, 2026-2036 (US$ Billion, AGR %)
Figure 154 Latin America Ophthalmic Drugs Market Share Forecast by Route of Administration, 2026 & 2036 (%)
Figure 155 Latin America Ophthalmic Drugs Market Forecast by Distribution Channel, 2026-2036 (US$ Billion, AGR %)
Figure 156 Latin America Ophthalmic Drugs Market Share Forecast by Distribution Channel, 2026 & 2036 (%)
Figure 157 Latin America Ophthalmic Drugs Market Forecast by Drug Type, 2026-2036 (US$ Billion, AGR %)
Figure 158 Latin America Ophthalmic Drugs Market Share Forecast by Drug Type, 2026 & 2036 (%)
Figure 159 Latin America Ophthalmic Drugs Market Forecast by Drug Class, 2026-2036 (US$ Billion, AGR %)
Figure 160 Latin America Ophthalmic Drugs Market Share Forecast by Drug Class, 2026 & 2036 (%)
Figure 161 Brazil Ophthalmic Drugs Market Forecast, 2026-2036 (US$ Billion, AGR %)
Figure 162 Mexico Ophthalmic Drugs Market Forecast, 2026-2036 (US$ Billion, AGR %)
Figure 163 Argentina Ophthalmic Drugs Market Forecast, 2026-2036 (US$ Billion, AGR %)
Figure 164 Chole Ophthalmic Drugs Market Forecast, 2026-2036 (US$ Billion, AGR %)
Figure 165 Rest of Latin America Ophthalmic Drugs Market Forecast, 2026-2036 (US$ Billion, AGR %)
Figure 166 MEA Ophthalmic Drugs Market Attractiveness Index
Figure 167 MEA Ophthalmic Drugs Market by Region, 2026, 2031 & 2036 (US$ Billion)
Figure 168 MEA Ophthalmic Drugs Market Forecast by Country, 2026-2036 (US$ Billion, AGR %)
Figure 169 MEA Ophthalmic Drugs Market Share Forecast by Country, 2026 & 2036 (%)
Figure 170 MEA Ophthalmic Drugs Market Forecast by Indication, 2026-2036 (US$ Billion, AGR %)
Figure 171 MEA Ophthalmic Drugs Market Share Forecast by Indication, 2026 & 2036 (%)
Figure 172 MEA Ophthalmic Drugs Market Forecast by Type, 2026-2036 (US$ Billion, AGR %)
Figure 173 MEA Ophthalmic Drugs Market Share Forecast by Type, 2026 & 2036 (%)
Figure 174 MEA Ophthalmic Drugs Market Forecast by Route of Administration, 2026-2036 (US$ Billion, AGR %)
Figure 175 MEA Ophthalmic Drugs Market Share Forecast by Route of Administration, 2026 & 2036 (%)
Figure 176 MEA Ophthalmic Drugs Market Forecast by Distribution Channel, 2026-2036 (US$ Billion, AGR %)
Figure 177 MEA Ophthalmic Drugs Market Share Forecast by Distribution Channel, 2026 & 2036 (%)
Figure 178 MEA Ophthalmic Drugs Market Forecast by Drug Type, 2026-2036 (US$ Billion, AGR %)
Figure 179 MEA Ophthalmic Drugs Market Share Forecast by Drug Type, 2026 & 2036 (%)
Figure 180 MEA Ophthalmic Drugs Market Forecast by Drug Class, 2026-2036 (US$ Billion, AGR %)
Figure 181 MEA Ophthalmic Drugs Market Share Forecast by Drug Class, 2026 & 2036 (%)
Figure 182 GCC Ophthalmic Drugs Market Forecast, 2026-2036 (US$ Billion, AGR %)
Figure 183 South Africa Ophthalmic Drugs Market Forecast, 2026-2036 (US$ Billion, AGR %)
Figure 184 Rest of MEA Ophthalmic Drugs Market Forecast, 2026-2036 (US$ Billion, AGR %)
Figure 185 Novartis AG: Net Revenue, 2020-2025 (US$ Million, AGR %)
Figure 186 Novartis AG: Regional Market Shares (%), 2025
Figure 187 Novartis AG: Business Segment Market Shares (%), 2025
Figure 188 Novartis AG: R&D Expense, 2020-2025 (US$ Million, AGR %)
Figure 189 Bayer AG: Net Revenue, 2020-2024 (US$ Million, AGR %)
Figure 190 Bayer AG: Regional Market Shares (%), 2024
Figure 191 Bayer AG: Business Segment Market Shares (%), 2024
Figure 192 Bayer AG: R&D Expense, 2020-2024 (US$ Million, AGR %)
Figure 193 Pfizer Inc.: Net Revenue, 2020-2024 (US$ Million, AGR %)
Figure 194 Pfizer Inc.: R&D Expense, 2020-2024 (US$ Million, AGR %)
Figure 195 Pfizer Inc.: Regional Market Shares (%), 2024
Figure 196 Pfizer Inc.: Business Segment Market Shares (%), 2024
Figure 197 Bausch + Lomb Corporation: Revenue, 2020-2024 (US$ Million, AGR %)
Figure 198 Bausch + Lomb Corporation: R&D Expense, 2020-2024 (US$ Million, AGR %)
Figure 199 Bausch + Lomb Corporation.: Business Segment Market Shares (%), 2024
Figure 200 Santen Pharmaceutical Co., Ltd.: Annual Revenue, 2020-2025 (US$ Million, AGR %)
Figure 201 Santen Pharmaceutical Co., Ltd.: Regional Market Shares (%), 2025
Figure 202 Johnson & Johnson Services, Inc.: Annual Revenue, 2020-2025 (US$ Million, AGR %)
Figure 203 Johnson & Johnson Services, Inc.: Regional Market Shares (%), 2025
Figure 204 Johnson & Johnson Services, Inc.: Business Segment Market Shares (%), 2025
Figure 205 Johnson & Johnson Services Inc.: R&D Expense, 2020-2025 (US$ Million, AGR %)
Figure 206 Regeneron Pharmaceuticals Inc.: Annual Revenue, 2020-2025 (US$ Million, AGR %)
Figure 207 Regeneron Pharmaceuticals Inc: R&D Expense, 2020-2025 (US$ Million, AGR %)
Figure 208 AbbVie Inc.: Annual Revenue, 2020-2025 (US$ Million, AGR %)
Figure 209 AbbVie: Regional Market Shares (%), 2025
Figure 210 AbbVie: Business Segment Market Shares (%), 2025
Figure 211 AbbVie Inc.: R&D Expense, 2020-2025 (US$ Million, AGR %)
Figure 212 F. Hoffmann-La Roche Ltd: Net Revenue, 2020-2024 (US$ Million, AGR %)
Figure 213 F. Hoffmann-La Roche Ltd.: Business Segment Market Shares (%), 2024
Figure 214 F. Hoffmann-La Roche Ltd: R&D Expense, 2020-2024 (US$ Million, AGR %)
Figure 215 Teva Pharmaceutical Industries Ltd.: Annual Revenue, 2020-2025 (US$ Million, AGR%)
Figure 216 Teva Pharmaceutical Industries Ltd.: Regional Market Shares (%), 2025
Figure 217 Teva Pharmaceutical Industries Ltd.: R&D Expense, 2020-2025 (US$ Million, AGR %)
Figure 218 Apellis Pharmaceuticals: Annual Revenue, 2020-2024 (US$ Million, AGR %)
Figure 219 Nicox: Net Revenue, 2020-2024 (US$ Million, AGR %)
Figure 220 Alcon: Net Revenue, 2020-2024 (US$ Million, AGR %)
Figure 221 Alcon: Business Segment Market Shares (%), 2024
Figure 222 Alcon: Regional Market Shares (%), 2024
Figure 223 Alcon: R&D Expense, 2020-2024 (US$ Million, AGR %)
Figure 224 Viatris Inc.: Net Revenue, 2020-2024 (US$ Million, AGR %)
Figure 225 Viatris Inc.: Regional Market Shares (%), 2024
Figure 226 Viatris Inc.: R&D Expense, 2020-2024 (US$ Million, AGR %)
Figure 227 Sun Pharmaceutical Industries Ltd.: Net Revenue, 2020-2025 (US$ Million, AGR %)
Figure 228 Sun Pharmaceutical Industries Ltd.: R&D Expense, 2020-2025 (US$ Million, AGR %)
ページTOPに戻る
本レポートと同じKEY WORD()の最新刊レポート
- 本レポートと同じKEY WORDの最新刊レポートはありません。
よくあるご質問
Visiongain社はどのような調査会社ですか?
英国の調査会社ヴィジョンゲイン社(Visiongain)は、通信とエネルギーのほか、自動車や化学・医薬品、金属など、広範な市場を対象に調査を行っています。自動車市場については、市場全般に関する調査のほ... もっと見る
調査レポートの納品までの日数はどの程度ですか?
在庫のあるものは速納となりますが、平均的には 3-4日と見て下さい。
但し、一部の調査レポートでは、発注を受けた段階で内容更新をして納品をする場合もあります。
発注をする前のお問合せをお願いします。
注文の手続きはどのようになっていますか?
1)お客様からの御問い合わせをいただきます。
2)見積書やサンプルの提示をいたします。
3)お客様指定、もしくは弊社の発注書をメール添付にて発送してください。
4)データリソース社からレポート発行元の調査会社へ納品手配します。
5) 調査会社からお客様へ納品されます。最近は、pdfにてのメール納品が大半です。
お支払方法の方法はどのようになっていますか?
納品と同時にデータリソース社よりお客様へ請求書(必要に応じて納品書も)を発送いたします。
お客様よりデータリソース社へ(通常は円払い)の御振り込みをお願いします。
請求書は、納品日の日付で発行しますので、翌月最終営業日までの当社指定口座への振込みをお願いします。振込み手数料は御社負担にてお願いします。
お客様の御支払い条件が60日以上の場合は御相談ください。
尚、初めてのお取引先や個人の場合、前払いをお願いすることもあります。ご了承のほど、お願いします。
データリソース社はどのような会社ですか?
当社は、世界各国の主要調査会社・レポート出版社と提携し、世界各国の市場調査レポートや技術動向レポートなどを日本国内の企業・公官庁及び教育研究機関に提供しております。
世界各国の「市場・技術・法規制などの」実情を調査・収集される時には、データリソース社にご相談ください。
お客様の御要望にあったデータや情報を抽出する為のレポート紹介や調査のアドバイスも致します。
|
|

