放射性医薬品療法市場レポート:2026-2036
Radiopharmaceutical Therapies Market Report 2026-2036
説明 Visiongainは新たなレポートを発表しました。 「放射性医薬品療法市場レポート 2026-2036」 。世界の放射性医薬品治療市場は、2026年に76億5,000万米ドルの規模に達し、予測期間中は年平均成長率(C... もっと見る
※上記価格は部署ライセンス(Departmental licence)価格です。
その他の価格についてはデータリソースまでお問合せください。
日本語のページはAI翻訳を利用し作成しています。
実際のレポートは英文のみでご納品いたします。

|
サマリー 説明 Visiongainは新たなレポートを発表しました。「放射性医薬品療法市場レポート 2026-2036」。世界の放射性医薬品治療市場は、2026年に76億5,000万米ドルの規模に達し、予測期間中は年平均成長率(CAGR)15.3%で拡大し、2036年には316億5,000万米ドルに達すると予測されている。 本レポートは、放射性同位体種、治療法、適応症、エンドユーザーセグメントを網羅し、世界の放射性医薬品治療市場について包括的な分析を提供しています。 本レポートには、地域および国別の需要予測、競合環境の評価、市場を牽引する主要企業のプロファイルに加え、米国の貿易関税が調達および製造の経済性に与える影響に関する詳細な分析が含まれています。 アクチニウム-225:臨床分野での進展と供給拡大が市場の成長を後押し 開発各社が、確立されたベータ線放出型プラットフォームを超えた治療選択肢の拡大を模索する中、アクチニウム-225を用いた治療法への投資が増加している。標的型アルファ線治療は、臨床開発パイプラインの進展に加え、既存の治療法では効果が限定的である症例に対処できるアルファ線放出体治療の可能性に対する信頼が高まっていることを背景に、予測期間において最も急速に成長する治療分野になると見込まれている。 臨床試験の進展により、主要なアルファ療法候補薬に対する投資魅力が高まっています。2026年10月、ブリストル・マイヤーズ スクイブ社は、RYZ101 (225Ac-DOTATATE)が、ルテチウム-177を用いた治療後に病勢が進行した胃腸膵神経内分泌腫瘍(GEP-NET)患者を対象とした第III相ACTION-1試験の中間解析において、主要評価項目である無増悪生存期間(PFS)を達成したと報告した。 この結果は、重要な治療の空白を埋める可能性を裏付けるものであり、アクチニウム-225を用いた治療に関する後期段階の証拠を提供するものである。 こうしたプログラムの進展に伴い、信頼性の高い同位体の供給の重要性が高まっています。2026年5月、テラパワー・アイソトープスは、フィラデルフィアに4億5,000万米ドルを投じたアクチニウム225製造施設の建設を開始しました。これは、供給の制約を緩和するとともに、パイプライン全体にわたる臨床開発および将来的な商業化を支援するために必要な生産能力を確保することを目的としています。 市場拡大を制約する規制および製造コンプライアンス要件 放射性医薬品の生産を拡大するには、製造業者は、厳格に管理された生産および納入スケジュールの中で、医薬品の品質および放射線安全に関する要件を満たす必要があります。適正製造規範(GMP)への準拠、専門的な品質管理、および放射性物質の許認可取得には、サプライチェーン全体にわたる継続的な投資が求められます。各国における許認可手続きの違いは、施設を設立したり、複数の市場に供給したりする企業にとって、さらなる複雑さを生じさせています。 コンプライアンス体制の構築コストに加え、施設の適格性確認や認可取得に要する時間は、操業開始の遅れを招き、市場参入や生産拡大に必要な投資額を押し上げる可能性があります。 このことは、ITM社が2026年8月に177Lu-エドトレオチドに関して受けた「完全回答要求書(Complete Response Letter)」に如実に表れている。この文書において、FDAは化学・製造・品質管理(CMC)上の問題や第三者による商業施設の査察結果を指摘したが、臨床上の安全性や有効性に関する懸念は一切示されなかった。 米国原子力規制委員会(NRC)が2026年5月に提案した副産物物質の許認可枠組みの改正案など、許認可手続きの簡素化に向けた取り組みにより、一部の行政上の要件は緩和される可能性があるものの、製造業者は、新施設の計画や市場参入のスケジュールを評価する際、コンプライアンスに伴う負担の全体像を引き続き考慮しなければならない。 レポートの範囲とデータの対象範囲 - 2026年から2036年までの市場収益予測(世界、地域、国、およびセグメント別)
- 放射性同位体種、治療法、適応症、およびエンドユーザー別の定量分析
- 北米、欧州、アジア太平洋、ラテンアメリカ、中東・アフリカの地域別予測
- 米国、カナダ、ドイツ、英国、フランス、イタリア、スペイン、スイス、ポーランド、ベルギー、オランダ、日本、中国、インド、オーストラリア、韓国、ブラジル、メキシコ、GCC、南アフリカ、エジプトを含む21の市場に関する全国レベルの予測
- 財務実績、戦略、最近の動向などを含む、25社の主要企業の概要
- 米国セクション232関税が放射性医薬品の調達および製造の経済性に与える影響に関する詳細な分析
- 市場の推進要因、阻害要因、機会、および競争の動向に関する分析
セグメンテーションの枠組み 放射性同位体の種類別 - ルテチウム-177
- アクチニウム-225
- イットリウム-90
- ヨウ素131
- ラジウム-223
- その他
治療の種類別 - PRRT以外の放射性リガンド療法(RLT)
- ペプチド受容体標的放射性核種療法(PRRT)
- 標的指向型アルファ療法(TAT)
- ラジオ免疫療法
- 近接照射療法 & その他
適応別 - 前立腺がん
- 神経内分泌腫瘍(NET)
- 甲状腺がん
- リンパ腫
- 骨転移
- その他
エンドユーザー別 - 病院
- 専門・総合がんセンター
- 診断・核医学画像診断センター
- その他
対象地域 北米 ヨーロッパ - ドイツ
- イギリス
- フランス
- イタリア
- スペイン
- スイス
- ポーランド
- ベルギー
- オランダ
アジア太平洋地域 ラテンアメリカ 中東・アフリカ 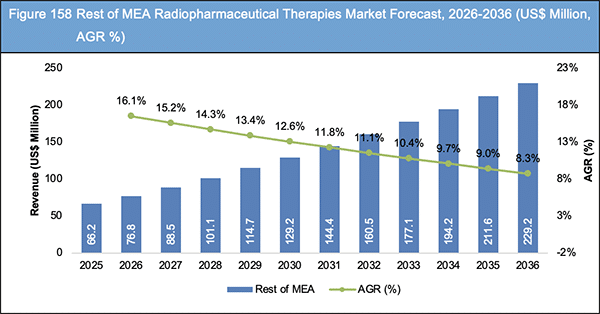 企業情報に関する報道 Visiongainは、放射性医薬品治療市場で事業を展開する25社の主要企業を分析しており、その対象には放射性同位体メーカー、治療法開発企業、受託製造業者、診断薬メーカーなどが含まれています。 - アクチニウム・ファーマシューティカルズ社
- ARTBIO, Inc.
- AdvanCell Pty Ltd.
- アリセウム・セラピューティクス
- バイエルAG
- Bracco Imaging S.p.A.
- ブリストル・マイヤーズ スクイブ社(RayzeBio)
- カーディナル・ヘルス社
- クラリティ・ファーマシューティカルズ社
- コンバージェント・セラピューティクス社
- Curium Holding フランス S.A.S
- エッカート&ツィーグラー
- イーライ・リリー・アンド・カンパニー
- フュージョン・ファーマシューティカルズ社(アストラゼネカ)
- GEヘルスケア・テクノロジーズ社
- ITM Isotope Technologies Munich SE
- ランテウス・ホールディングス社
- ノーススター・メディカル・テクノロジーズLLC(ノーススター)
- ノバルティスAG
- オラノ・メド
- パースペクティブ・セラピューティクス社
- RadioMedix, Inc.
- Ratio Therapeutics, Inc.
- シーメンス・ヘルスインアーズAG
- テリックス・ファーマシューティカルズ・リミテッド
各プロフィールには以下の内容が含まれています: - 企業概要と戦略的ポジショニング
- 放射性医薬品の製品ラインナップおよび開発パイプラインの状況
- 主要な提携関係、製造に関する取り決め、および規制上の重要な節目
- 最近の動向と競争環境の見通し
主な疑問への回答 - 世界の放射性医薬品治療市場の現在の規模と将来の見通しはどのようになっていますか?
- どの放射性同位体、治療法、適応症が最も急速に拡大しているのでしょうか?
- どのエンドユーザー向けチャネルや地域が、最大のビジネスチャンスをもたらすでしょうか?
- How are アメリカ合衆国 Section 232 tariffs affecting radiopharmaceutical sourcing and manufacturing decisions?
- アクチニウム225および鉛212を用いた治療法の進歩は、競争環境をどのように変えることになるのでしょうか?
- 主要企業はどの企業であり、サプライチェーンへの投資や提携を通じてどのような戦略的ポジションを築いているのでしょうか?
- 市場拡大における主な規制上およびコンプライアンス上の制約にはどのようなものがありますか?
- ANDAに基づく新規参入企業や開発後期段階のパイプライン候補は、確立された適応症における競争にどのような影響を与えるでしょうか?
ページTOPに戻る
目次
1 レポートの概要
1.1 本調査の目的
1.2 放射性医薬品治療市場の概要
1.3 本レポートの内容
1.4 本レポートを読むべき理由
1.5 本分析レポートが回答する主要な質問
1.6 本レポートの対象読者
1.7 調査方法
1.7.1 市場の定義
1.7.2 市場評価および予測の方法
1.7.3 データの検証
1.7.3.1 一次調査
1.7.3.2 二次調査
1.8 よくある質問(FAQ)
1.9 関連するVisiongainレポート
1.10 Visiongainについて
2 概要
3 市場の概要
3.1 主な調査結果
3.2 市場の動向
3.3 影響分析
3.3.1 市場の推進要因
3.3.1.1 世界的ながん発症率の上昇と標的療法への需要の増加
3.3.1.2 放射性リガンド療法(RLT)に対する臨床的・規制面での機運の高まり
3.3.1.3 セラノスティクスの導入拡大
3.3.1.4 新規同位体生産能力への投資増加
3.3.2 市場の抑制要因
3.3.2.1 半減期の短さと放射性同位元素のサプライチェーンの複雑さ
3.3.2.2 治療費の高騰と保険償還に関する課題
3.3.2.3 GMP製造および流通インフラの制約
3.3.2.4 放射線安全、取り扱い、および規制遵守の負担
3.3.3 市場の機会
3.3.3.1 新たなアルファ線放出体パイプライン(アクチニウム-225、鉛-212)
3.3.3.2 新たな固形がん適応症への拡大
3.3.3.3 分散型放射性医薬品調製と地域別流通
3.3.3.4 戦略的なCDMOおよび同位体供給パートナーシップ
3.4 市場動向
3.5 米国の関税:世界の放射性医薬品治療市場に与える影響は?
3.5.1 概要
3.5.2 V字型回復シナリオ
3.5.2.1 なぜV字型回復なのか?
3.5.2.2 関税による影響
3.5.2.3 市場の動向と需要の回復
3.5.2.4 政策および資金面での支援
3.5.2.5 回復までの期間
3.5.3 U字型回復シナリオ
3.5.3.1 なぜU字型回復なのか?
3.5.3.2 関税による影響
3.5.3.3 市場の動向と需要の回復
3.5.3.4 政策および資金面での支援
3.5.3.5 回復までの期間
3.5.4 L字型回復シナリオ
3.5.4.1 なぜL字型回復なのか?
3.5.4.2 関税の影響
3.5.4.3 市場の動向と需要の回復
3.5.4.4 政策および資金面での支援
3.5.4.5 回復までの期間
3.5.5 顧客は短期(2026年~2031年)および長期(2026年~2036年)の計画において、どのような戦略的考慮事項を盛り込むべきか?
3.5.6 米中貿易戦争が放射性医薬品治療市場に与える影響
3.6 SWOT分析
3.6.1 強み
3.6.2 弱み
3.6.3 機会
3.6.4 脅威
3.7 ポーターの5つの力分析
3.7.1 供給者の交渉力(低~中)
3.7.2 購入者の交渉力(低)
3.7.3 競合他社間の競争(高)
3.7.4 代替品からの脅威(低)
3.7.5 新規参入の脅威(低~中)
3.8 PEST分析
3.9 サプライチェーン分析
3.9.1 サプライチェーンの流れ
3.9.2 サプライチェーンに影響を与える主なトレンド
4 放射性医薬品治療市場の分析:放射性同位体種別
4.1 主な調査結果
4.2 放射性同位体種別セグメント:市場魅力度指数
4.3 放射性同位体種別における放射性医薬品療法の市場規模推計および予測
4.4 ルテチウム-177
4.4.1 地域別市場規模、2026年~2036年(百万米ドル)
4.4.2 地域別市場シェア、2026年および2036年(%)
4.5 アクチニウム-225
4.5.1 地域別市場規模、2026年~2036年(百万米ドル)
4.5.2 地域別市場シェア、2026年および2036年(%)
4.6 イットリウム-90
4.6.1 地域別市場規模、2026年~2036年(百万米ドル)
4.6.2 地域別市場シェア、2026年および2036年(%)
4.7 ヨウ素-131
4.7.1 地域別市場規模、2026年~2036年(百万米ドル)
4.7.2 地域別市場シェア、2026年および2036年(%)
4.8 ラジウム-223
4.8.1 地域別市場規模、2026年~2036年(百万米ドル)
4.8.2 地域別市場シェア、2026年および2036年(%)
4.9 その他
4.9.1 地域別市場規模、2026年~2036年(百万米ドル)
4.9.2 地域別市場シェア、2026年および2036年(%)
5 放射性医薬品療法市場の分析:治療法別
5.1 主な調査結果
5.2 治療法別セグメント:市場魅力度指数
5.3 治療法別放射性医薬品療法市場の規模推計および予測
5.4 非PRRT放射性リガンド療法(RLT)
5.4.1 地域別市場規模、2026年~2036年(百万米ドル)
5.4.2 地域別市場シェア、2026年および2036年(%)
5.5 ペプチド受容体放射性核種療法 (PRRT)
5.5.1 地域別市場規模、2026年~2036年(百万米ドル)
5.5.2 地域別市場シェア、2026年および2036年(%)
5.6 標的アルファ療法(TAT)
5.6.1 地域別市場規模、2026年~2036年(百万米ドル)
5.6.2 地域別市場シェア、2026年および2036年(%)
5.7 ラジオイムノセラピー
5.7.1 地域別市場規模、2026年~2036年(百万米ドル)
5.7.2 地域別市場シェア、2026年および2036年(%)
5.8 近接照射療法およびその他
5.8.1 地域別市場規模、2026年~2036年(百万米ドル)
5.8.2 地域別市場シェア、2026年および2036年(%)
6 放射性医薬品治療市場の分析:適応別
6.1 主な調査結果
6.2 適応症セグメント:市場魅力度指数
6.3 適応症別放射性医薬品治療市場の規模推計および予測
6.4 前立腺がん
6.4.1 地域別市場規模、2026年~2036年(百万米ドル)
6.4.2 地域別市場シェア、2026年および2036年(%)
6.5 神経内分泌腫瘍(NET)
6.5.1 地域別市場規模、2026年~2036年(百万米ドル)
6.5.2 地域別市場シェア、2026年および2036年(%)
6.6 甲状腺がん
6.6.1 地域別市場規模、2026年~2036年(百万米ドル)
6.6.2 地域別市場シェア、2026年および2036年(%)
6.7 リンパ腫
6.7.1 地域別市場規模、2026年~2036年(百万米ドル)
6.7.2 地域別市場シェア、2026年および2036年(%)
6.8 骨転移
6.8.1 地域別市場規模、2026年~2036年(百万米ドル)
6.8.2 地域別市場シェア、2026年および2036年(%)
6.9 その他
6.9.1 地域別市場規模、2026年~2036年(百万米ドル)
6.9.2 地域別市場シェア、2026年および2036年(%)
7 放射性医薬品療法市場の分析:エンドユーザー別
7.1 主な調査結果
7.2 エンドユーザーセグメント:市場魅力度指数
7.3 エンドユーザー別放射性医薬品治療市場の規模推計および予測
7.4 病院
7.4.1 地域別市場規模、2026年~2036年(百万米ドル)
7.4.2 地域別市場シェア、2026年および2036年(%)
7.5 専門・総合がんセンター
7.5.1 地域別市場規模、2026年~2036年(百万米ドル)
7.5.2 地域別市場シェア、2026年および2036年(%)
7.6 診断・核医学画像診断センター
7.6.1 地域別市場規模、2026年~2036年(百万米ドル)
7.6.2 地域別市場シェア、2026年および2036年(%)
7.7 その他
7.7.1 地域別市場規模、2026年~2036年(百万米ドル)
7.7.2 地域別市場シェア、2026年および2036年(%)
8 放射性医薬品治療市場分析:地域別
8.1 主な調査結果
8.2 地域別の主要製造拠点
8.3 地域別の市場規模の推計と予測
9 北米の放射性医薬品治療市場分析
9.1 主な調査結果
9.2 北米放射性医薬品治療市場の魅力度指数
9.3 北米放射性医薬品治療市場:国別、2026年、2031年、2036年(百万米ドル)
9.4 北米放射性医薬品治療市場の規模推計および予測(国別)
9.5 北米放射性医薬品治療市場の規模推計および予測(放射性同位体種別)
9.6 北米放射性医薬品治療市場の規模推計および予測(治療法別)
9.7 北米放射性医薬品治療市場の規模推計および予測(適応症別)
9.8 北米放射性医薬品治療市場の規模推計および予測(エンドユーザー別)
9.9 米国の放射性医薬品治療市場の分析
9.10 カナダの放射性医薬品治療市場の分析
10 欧州の放射性医薬品治療市場分析
10.1 主な調査結果
10.2 欧州放射性医薬品治療市場の魅力度指数
10.3 欧州放射性医薬品治療市場:国別、2026年、2031年、2036年(百万米ドル)
10.4 欧州放射性医薬品治療市場の規模推計および予測(国別)
10.5 欧州放射性医薬品治療市場の規模推計および予測(放射性同位体種別)
10.6 欧州放射性医薬品治療市場の規模推計および予測(治療法別)
10.7 欧州放射性医薬品治療市場の規模推計および予測(適応症別)
10.8 欧州放射性医薬品治療市場の規模推計および予測(エンドユーザー別)
10.9 ドイツの放射性医薬品治療市場の分析
10.10 フランスの放射性医薬品治療市場の分析
10.11 英国の放射性医薬品治療市場の分析
10.12 イタリアの放射性医薬品治療市場の分析
10.13 スペインの放射性医薬品治療市場の分析
10.14 スイスの放射性医薬品治療市場の分析
10.15 ポーランドの放射性医薬品治療市場の分析
10.16 ベルギーの放射性医薬品治療市場の分析
10.17 オランダにおける放射性医薬品治療市場の分析
10.18 その他の欧州地域の放射性医薬品治療市場の分析
11 アジア太平洋地域の放射性医薬品治療市場の分析
11.1 主な調査結果
11.2 アジア太平洋地域の放射性医薬品治療市場の魅力度指数
11.3 アジア太平洋地域の放射性医薬品治療市場:国別、2026年、2031年、2036年(百万米ドル)
11.4 アジア太平洋地域の放射性医薬品治療市場の規模推計および予測(国別)
11.5 アジア太平洋地域の放射性医薬品治療市場の規模推計および予測(放射性同位体種別)
11.6 アジア太平洋地域の放射性医薬品治療市場の規模推計および予測(治療法別)
11.7 アジア太平洋地域の放射性医薬品治療市場の規模推計および予測(適応症別)
11.8 アジア太平洋地域の放射性医薬品治療市場の規模推計および予測(エンドユーザー別)
11.9 中国の放射性医薬品治療市場の分析
11.10 日本の放射性医薬品治療市場の分析
11.11 インドの放射性医薬品治療市場の分析
11.12 韓国の放射性医薬品治療市場の分析
11.13 オーストラリアの放射性医薬品治療市場の分析
11.14 その他のアジア太平洋地域の放射性医薬品治療市場の分析
12 ラテンアメリカの放射性医薬品治療市場分析
12.1 主な調査結果
12.2 ラテンアメリカ放射性医薬品治療市場の魅力度指数
12.3 ラテンアメリカ放射性医薬品治療市場:国別、2026年、2031年、2036年(百万米ドル)
12.4 ラテンアメリカ放射性医薬品治療市場の規模推計および予測(国別)
12.5 ラテンアメリカ放射性医薬品治療市場の規模推計および予測(放射性同位体種別)
12.6 ラテンアメリカ放射性医薬品治療市場の規模推計および予測(治療法別)
12.7 ラテンアメリカ放射性医薬品治療市場の規模推計および予測(適応症別)
12.8 ラテンアメリカ放射性医薬品治療市場の規模推計および予測(エンドユーザー別)
12.9 ブラジルの放射性医薬品治療市場の分析
12.10 メキシコの放射性医薬品治療市場の分析
12.11 その他のラテンアメリカ地域の放射性医薬品治療市場の分析
13 MEAの放射性医薬品治療市場の分析
13.1 主な調査結果
13.2 MEA放射性医薬品治療市場の市場魅力度指数
13.3 MEA放射性医薬品治療市場:国別、2026年、2031年、2036年(百万米ドル)
13.4 MEA放射性医薬品治療市場の規模推計および予測(国別)
13.5 MEA放射性医薬品治療市場の規模推計および予測(放射性同位体種別)
13.6 MEA放射性医薬品治療市場の規模推計および予測(治療法別)
13.7 MEA放射性医薬品治療市場の規模推計および予測(適応症別)
13.8 MEA放射性医薬品治療市場の規模推計および予測(エンドユーザー別)
13.9 GCCの放射性医薬品治療市場の分析
13.10 南アフリカの放射性医薬品治療市場の分析
13.11 エジプトの放射性医薬品治療市場の分析
13.12 その他のMEA地域における放射性医薬品治療市場の分析
14 主要企業のプロフィール
14.1 2025年の競争環境
14.2 戦略的展望
14.3 ノバルティスAG
14.3.1 企業概要
14.3.2 会社概要
14.3.3 財務分析
14.3.3.1 純売上高(2021年~2025年)
14.3.3.2 研究開発費(2021年~2025年)
14.3.3.3 地域別市場シェア(2025年)
14.3.3.4 事業セグメント別市場シェア(2025年)
14.3.4 製品ベンチマーキング
14.3.5 戦略的展望
14.4 ランテウス・ホールディングス社
14.4.1 企業概要
14.4.2 会社概要
14.4.3 財務分析
14.4.3.1 純売上高(2021年~2025年)
14.4.3.2 研究開発(R&D)(2021年~2025年)
14.4.3.3 地域別市場シェア(2025年)
14.4.3.4 事業セグメント別市場シェア(2025年)
14.4.4 製品ベンチマーク
14.4.5 戦略的展望
14.5 バイエルAG
14.5.1 企業概要
14.5.2 会社概要
14.5.3 財務分析
14.5.3.1 純売上高、2021年~2025年
14.5.3.2 研究開発費(2021年~2025年)
14.5.3.3 地域別市場シェア(2025年)
14.5.3.4 事業セグメント別市場シェア(2025年)
14.5.4 製品ベンチマーキング
14.5.5 戦略的展望
14.6 イーライ・リリー・アンド・カンパニー
14.6.1 企業概要
14.6.2 会社概要
14.6.3 財務分析
14.6.3.1 純売上高(2021年~2025年)
14.6.3.2 研究開発費(2021年~2025年)
14.6.3.3 地域別市場シェア(2025年)
14.6.3.4 事業セグメント別市場シェア(2025年)
14.6.4 製品ベンチマーク
14.6.5 戦略的展望
14.7 テリックス・ファーマシューティカルズ・リミテッド
14.7.1 企業概要
14.7.2 会社概要
14.7.3 財務分析
14.7.3.1 純売上高(2021年~2025年)
14.7.3.2 研究開発(R&D)(2021年~2025年)
14.7.3.3 地域別市場シェア(2025年)
14.7.3.4 事業セグメント別市場シェア(2025年)
14.7.4 製品ベンチマーキング
14.7.5 戦略的展望
14.8 GEヘルスケア・テクノロジーズ社
14.8.1 企業概要
14.8.2 会社概要
14.8.3 財務分析
14.8.3.1 純売上高、2021-2025年
14.8.3.2 研究開発費(2021年~2025年)
14.8.3.3 地域別市場シェア(2025年)
14.8.3.4 事業セグメント別市場シェア(2025年)
14.8.4 製品ベンチマーク
14.8.5 戦略的展望
14.9 シーメンス・ヘルスインアーズAG
14.9.1 企業概要
14.9.2 会社概要
14.9.3 財務分析
14.9.3.1 純売上高(2021年~2025年)
14.9.3.2 地域別市場シェア(2025年)
14.9.3.3 事業セグメント別市場シェア(2025年)
14.9.4 製品ベンチマーク
14.9.5 戦略的展望
14.10 カーディナル・ヘルス社(Cardinal Health, Inc.)
14.10.1 企業概要
14.10.2 会社概要
14.10.3 財務分析
14.10.3.1 純売上高(2021年~2025年)
14.10.3.2 地域別市場シェア(2025年)
14.10.3.3 事業セグメント別市場シェア(2025年)
14.10.4 製品ベンチマーク
14.10.5 戦略的展望
14.11 クラリティ・ファーマシューティカルズ社
14.11.1 企業概要
14.11.2 会社概要
14.11.3 財務分析
14.11.3.1 純売上高(2021年~2025年)
14.11.3.2 研究開発費(2021年~2025年)
14.11.4 製品ベンチマーキング
14.11.5 戦略的展望
14.12 アクチニウム・ファーマシューティカルズ社
14.12.1 企業概要
14.12.2 会社概要
14.12.3 財務分析
14.12.3.1 純売上高(2021年~2025年)
14.12.3.2 地域別市場シェア(2025年)
14.12.4 製品ベンチマーキング
14.12.5 戦略的展望
14.13 パースペクティブ・セラピューティクス社
14.13.1 企業概要
14.13.2 会社概要
14.13.3 財務分析
14.13.3.1 純売上高(2021年~2025年)
14.13.3.2 研究開発費(2021年~2025年)
14.13.3.3 事業セグメント別市場シェア(2025年)
14.13.4 製品ベンチマーク
14.13.5 戦略的展望
14.14 Curium Holding France S.A.S
14.14.1 企業概要
14.14.2 会社概要
14.14.3 製品ベンチマーク
14.14.4 戦略的展望
14.15 ブラッコ・イメージング(Bracco Imaging S.p.A.)
14.15.1 企業概要
14.15.2 会社概要
14.15.3 製品ベンチマーク
14.15.4 戦略的展望
14.16 ITM Isotope Technologies Munich SE
14.16.1 企業概要
14.16.2 会社概要
14.16.3 製品ベンチマーク
14.16.4 戦略的展望
14.17 オラノ・メッド
14.17.1 会社概要
14.17.2 会社概要
14.17.3 製品ベンチマーク
14.17.4 戦略的展望
14.18 RadioMedix, Inc.
14.18.1 企業概要
14.18.2 会社概要
14.18.3 製品ベンチマーク
14.18.4 戦略的展望
14.19 フュージョン・ファーマシューティカルズ社
14.19.1 企業概要
14.19.2 会社概要
14.19.3 製品ベンチマーク
14.19.4 戦略的展望
14.20 ARTBIO, Inc.
14.20.1 企業概要
14.20.2 会社概要
14.20.3 製品ベンチマーク
14.21 アドバンセル(AdvanCell Pty Ltd)
14.21.1 企業概要
14.21.2 会社概要
14.21.3 製品ベンチマーク
14.22 レシオ・セラピューティクス(Ratio Therapeutics, Inc.)
14.22.1 企業概要
14.22.2 会社概要
14.22.3 製品ベンチマーク
14.22.4 戦略的展望
14.23 エッカート・アンド・ジーグラー
14.23.1 企業概要
14.23.2 会社概要
14.23.3 財務分析
14.23.3.1 純売上高(2021年~2025年)
14.23.3.2 研究開発費(2021年~2025年)
14.23.3.3 事業セグメント別市場シェア(2025年)
14.23.4 製品ベンチマーキング
14.23.5 戦略的展望
14.24 ブリストル・マイヤーズ スクイブ社
14.24.1 企業概要
14.24.2 会社概要
14.24.3 財務分析
14.24.3.1 純売上高、2021年~2025年
14.24.3.2 研究開発(R&D)、2021年~2025年
14.24.3.3 事業セグメント別市場シェア(2025年)
14.24.4 製品ベンチマーク
14.24.5 戦略的展望
14.25 コンバージェント・セラピューティクス社
14.25.1 企業概要
14.25.2 会社概要
14.25.3 製品ベンチマーク
14.26 Ariceum Therapeutics GmbH
14.26.1 企業概要
14.26.2 会社概要
14.26.3 製品ベンチマーク
14.26.4 戦略的展望
14.27 NorthStar Medical Technologies, LLC(NorthStar)
14.27.1 企業概要
14.27.2 会社概要
14.27.3 製品ベンチマーク
15 結論と提言
15.1 Visiongainによる総括
15.2 市場関係者への提言
ページTOPに戻る
図表リスト
List of Tables
Table 1: Radiopharmaceutical Therapies Market Snapshot, 2026 & 2036 (US$ Million, CAGR %)
Table 2: Radiopharmaceutical Therapies Market: Impact Analysis
Table 3: Radiopharmaceutical Therapies Market Forecast by Region, 2026-2036 (US$ Million, AGR%, CAGR%): “V” Shaped Recovery
Table 4: Radiopharmaceutical Therapies Market Forecast by Region, 2026-2036 (US$ Million, AGR%, CAGR%): “U” Shaped Recovery
Table 5: Radiopharmaceutical Therapies Market Forecast by Region, 2026-2036 (US$ Million, AGR%, CAGR%): “L” Shaped Recovery
Table 6: Radiopharmaceutical Therapies Market Forecast by Radioisotope Type, 2026-2036 (US$ Million, AGR%, CAGR%)
Table 7: Lutetium-177 Segment Market Forecast by Region, 2026-2036 (US$ Million, AGR%, CAGR%)
Table 8: Actinium-225 Segment Market Forecast by Region, 2026-2036 (US$ Million, AGR%, CAGR%)
Table 9: Yttrium-90 Segment Market Forecast by Region, 2026-2036 (US$ Million, AGR%, CAGR%)
Table 10: Iodine-131 Segment Market Forecast by Region, 2026-2036 (US$ Million, AGR%, CAGR%)
Table 11: Radium-223 Segment Market Forecast by Region, 2026-2036 (US$ Million, AGR%, CAGR%)
Table 12: Others Segment Market Forecast by Region, 2026-2036 (US$ Million, AGR%, CAGR%)
Table 13: Radiopharmaceutical Therapies Market Forecast by Therapy Type, 2026-2036 (US$ Million, AGR%, CAGR%)
Table 14: Radioligand Therapy (RLT) Segment Market Forecast by Region, 2026-2036 (US$ Million, AGR%, CAGR%)
Table 15: Peptide Receptor Radionuclide Therapy (PRRT) Segment Market Forecast by Region, 2026-2036 (US$ Million, AGR%, CAGR%)
Table 16: Targeted Alpha Therapy (TAT) Segment Market Forecast by Region, 2026-2036 (US$ Million, AGR%, CAGR%)
Table 17: Radioimmunotherapy Segment Market Forecast by Region, 2026-2036 (US$ Million, AGR%, CAGR%)
Table 18: Brachytherapy & Others Segment Market Forecast by Region, 2026-2036 (US$ Million, AGR%, CAGR%)
Table 19: Radiopharmaceutical Therapies Market Forecast by Indication, 2026-2036 (US$ Million, AGR%, CAGR%)
Table 20: Prostate Cancer Segment Market Forecast by Region, 2026-2036 (US$ Million, AGR%, CAGR%)
Table 21: Neuroendocrine Tumors (NETs) Segment Market Forecast by Region, 2026-2036 (US$ Million, AGR%, CAGR%)
Table 22: Thyroid Cancer Segment Market Forecast by Region, 2026-2036 (US$ Million, AGR%, CAGR%)
Table 23: Lymphoma Segment Market Forecast by Region, 2026-2036 (US$ Million, AGR%, CAGR%)
Table 24: Bone Metastases Segment Market Forecast by Region, 2026-2036 (US$ Million, AGR%, CAGR%)
Table 25: Others Segment Market Forecast by Region, 2026-2036 (US$ Million, AGR%, CAGR%)
Table 26: Radiopharmaceutical Therapies Market Forecast by End-user, 2026-2036 (US$ Million, AGR%, CAGR%)
Table 27: Hospitals Segment Market Forecast by Region, 2026-2036 (US$ Million, AGR%, CAGR%)
Table 28: Specialty & Comprehensive Cancer Centers Segment Market Forecast by Region, 2026-2036 (US$ Million, AGR%, CAGR%)
Table 29: Diagnostic & Nuclear Medicine Imaging Centers Segment Market Forecast by Region, 2026-2036 (US$ Million, AGR%, CAGR%)
Table 30: Other Segment Market Forecast by Region, 2026-2036 (US$ Million, AGR%, CAGR%)
Table 31: Radiopharmaceutical Therapies Market: Regional Key Manufacturing Sites
Table 32: Radiopharmaceutical Therapies Market Forecast by Region, 2026-2036 (US$ Million, AGR%, CAGR%)
Table 33: North America Radiopharmaceutical Therapies Market Forecast by Country, 2026-2036 (US$ Million, AGR%, CAGR%)
Table 34: North America Radiopharmaceutical Therapies Market Forecast by Radioisotope Type, 2026-2036 (US$ Million, AGR%, CAGR%)
Table 35: North America Radiopharmaceutical Therapies Market Forecast by Therapy Type, 2026-2036 (US$ Million, AGR%, CAGR%)
Table 36: North America Radiopharmaceutical Therapies Market Forecast by Indication, 2026-2036 (US$ Million, AGR%, CAGR%)
Table 37: North America Radiopharmaceutical Therapies Market Forecast by End-users, 2026-2036 (US$ Million, AGR%, CAGR%)
Table 38: U.S. Radiopharmaceutical Therapies Market Forecast, 2026-2036 (US$ Million, AGR%, CAGR%)
Table 39: Canada Radiopharmaceutical Therapies Market Forecast, 2026-2036 (US$ Million, AGR%, CAGR%)
Table 40: Europe Radiopharmaceutical Therapies Market Forecast by Country, 2026-2036 (US$ Million, AGR%, CAGR%)
Table 41: Europe Radiopharmaceutical Therapies Market Forecast by Radioisotope Type, 2026-2036 (US$ Million, AGR%, CAGR%)
Table 42: Europe Radiopharmaceutical Therapies Market Forecast by Therapy Type, 2026-2036 (US$ Million, AGR%, CAGR%)
Table 43: Europe Radiopharmaceutical Therapies Market Forecast by Indication, 2026-2036 (US$ Million, AGR%, CAGR%)
Table 44: Europe Radiopharmaceutical Therapies Market Forecast by End-users, 2026-2036 (US$ Million, AGR%, CAGR%)
Table 45: Germany Radiopharmaceutical Therapies Market Forecast, 2026-2036 (US$ Million, AGR%, CAGR%)
Table 46: France Radiopharmaceutical Therapies Market Forecast, 2026-2036 (US$ Million, AGR%, CAGR%)
Table 47: UK Radiopharmaceutical Therapies Market Forecast, 2026-2036 (US$ Million, AGR%, CAGR%)
Table 48: Italy Radiopharmaceutical Therapies Market Forecast, 2026-2036 (US$ Million, AGR%, CAGR%)
Table 49: Spain Radiopharmaceutical Therapies Market Forecast, 2026-2036 (US$ Million, AGR%, CAGR%)
Table 50: Switzerland Radiopharmaceutical Therapies Market Forecast, 2026-2036 (US$ Million, AGR%, CAGR%)
Table 51: Poland Radiopharmaceutical Therapies Market Forecast, 2026-2036 (US$ Million, AGR%, CAGR%)
Table 52: Belgium Radiopharmaceutical Therapies Market Forecast, 2026-2036 (US$ Million, AGR%, CAGR%)
Table 53: Netherlands Radiopharmaceutical Therapies Market Forecast, 2026-2036 (US$ Million, AGR%, CAGR%)
Table 54: Rest of Europe Radiopharmaceutical Therapies Market Forecast, 2026-2036 (US$ Million, AGR%, CAGR%)
Table 55: Asia Pacific Radiopharmaceutical Therapies Market Forecast by Country, 2026-2036 (US$ Million, AGR%, CAGR%)
Table 56: Asia Pacific Radiopharmaceutical Therapies Market Forecast by Radioisotope Type, 2026-2036 (US$ Million, AGR%, CAGR%)
Table 57: Asia Pacific Radiopharmaceutical Therapies Market Forecast by Therapy Type, 2026-2036 (US$ Million, AGR%, CAGR%)
Table 58: Asia Pacific Radiopharmaceutical Therapies Market Forecast by Indication, 2026-2036 (US$ Million, AGR%, CAGR%)
Table 59: Asia Pacific Radiopharmaceutical Therapies Market Forecast by End-users, 2026-2036 (US$ Million, AGR%, CAGR%)
Table 60: China Radiopharmaceutical Therapies Market Forecast, 2026-2036 (US$ Million, AGR%, CAGR%)
Table 61: Japan Radiopharmaceutical Therapies Market Forecast, 2026-2036 (US$ Million, AGR%, CAGR%)
Table 62: India Radiopharmaceutical Therapies Market Forecast, 2026-2036 (US$ Million, AGR%, CAGR%)
Table 63: South Korea Radiopharmaceutical Therapies Market Forecast, 2026-2036 (US$ Million, AGR%, CAGR%)
Table 64: Australia Radiopharmaceutical Therapies Market Forecast, 2026-2036 (US$ Million, AGR%, CAGR%)
Table 65: Rest of Asia Pacific Radiopharmaceutical Therapies Market Forecast, 2026-2036 (US$ Million, AGR%, CAGR%)
Table 66: Latin America Radiopharmaceutical Therapies Market Forecast by Country, 2026-2036 (US$ Million, AGR%, CAGR%)
Table 67: Latin America Radiopharmaceutical Therapies Market Forecast by Radioisotope Type, 2026-2036 (US$ Million, AGR%, CAGR%)
Table 68: Latin America Radiopharmaceutical Therapies Market Forecast by Therapy Type, 2026-2036 (US$ Million, AGR%, CAGR%)
Table 69: Latin America Radiopharmaceutical Therapies Market Forecast by Indication, 2026-2036 (US$ Million, AGR%, CAGR%)
Table 70: Latin America Radiopharmaceutical Therapies Market Forecast by End-users, 2026-2036 (US$ Million, AGR%, CAGR%)
Table 71: Brazil Radiopharmaceutical Therapies Market Forecast, 2026-2036 (US$ Million, AGR%, CAGR%)
Table 72: Mexico Radiopharmaceutical Therapies Market Forecast, 2026-2036 (US$ Million, AGR%, CAGR%)
Table 73: Rest of Latin America Radiopharmaceutical Therapies Market Forecast, 2026-2036 (US$ Million, AGR%, CAGR%)
Table 74: MEA Radiopharmaceutical Therapies Market Forecast by Country, 2026-2036 (US$ Million, AGR%, CAGR%)
Table 75: MEA Radiopharmaceutical Therapies Market Forecast by Radioisotope Type, 2026-2036 (US$ Million, AGR%, CAGR%)
Table 76: MEA Radiopharmaceutical Therapies Market Forecast by Therapy Type, 2026-2036 (US$ Million, AGR%, CAGR%)
Table 77: MEA Radiopharmaceutical Therapies Market Forecast by Indication, 2026-2036 (US$ Million, AGR%, CAGR%)
Table 78: MEA Radiopharmaceutical Therapies Market Forecast by End-users, 2026-2036 (US$ Million, AGR%, CAGR%)
Table 79: GCC Radiopharmaceutical Therapies Market Forecast, 2026-2036 (US$ Million, AGR%, CAGR%)
Table 80: South Africa Radiopharmaceutical Therapies Market Forecast, 2026-2036 (US$ Million, AGR%, CAGR%)
Table 81: Egypt Radiopharmaceutical Therapies Market Forecast, 2026-2036 (US$ Million, AGR%, CAGR%)
Table 82: Rest of MEA Radiopharmaceutical Therapies Market Forecast, 2026-2036 (US$ Million, AGR%, CAGR%)
Table 83: Strategic Outlook Summary Table
Table 84: Novartis AG: Key Details
Table 85: Novartis AG: Product Benchmarking
Table 86: Novartis AG: Strategic Outlook
Table 87: Lantheus Holdings, Inc.: Key Details
Table 88: Lantheus Holdings, Inc.: Product Benchmarking
Table 89: Lantheus Holdings, Inc.: Strategic Outlook
Table 90: Bayer AG: Key Details
Table 91: Bayer AG: Product Benchmarking
Table 92: Bayer AG: Strategic Outlook
Table 93: Eli Lilly and Company: Key Details
Table 94: Eli Lilly and Company: Product Benchmarking
Table 95: Eli Lilly and Company: Strategic Outlook
Table 96: Telix Pharmaceuticals Limited: Key Details
Table 97: Telix Pharmaceuticals Limited: Product Benchmarking
Table 98: Telix Pharmaceuticals Limited: Strategic Outlook
Table 99: GE HealthCare Technologies Inc.: Key Details
Table 100: GE HealthCare Technologies Inc.: Product Benchmarking
Table 101: GE HealthCare Technologies Inc.: Strategic Outlook
Table 102: Siemens Healthineers AG: Key Details
Table 103: Siemens Healthineers AG: Product Benchmarking
Table 104: Siemens Healthineers AG: Strategic Outlook
Table 105: Cardinal Health, Inc.: Key Details
Table 106: Cardinal Health, Inc.: Product Benchmarking
Table 107: Cardinal Health, Inc.: Strategic Outlook
Table 108: Clarity Pharmaceuticals Ltd: Key Details
Table 109: Clarity Pharmaceuticals Ltd: Product Benchmarking
Table 110: Clarity Pharmaceuticals Ltd: Strategic Outlook
Table 111: Actinium Pharmaceuticals, Inc.: Key Details
Table 112: Actinium Pharmaceuticals, Inc.: Product Benchmarking
Table 113: Actinium Pharmaceuticals, Inc.: Strategic Outlook
Table 114: Perspective Therapeutics, Inc.: Key Details
Table 115: Perspective Therapeutics, Inc.: Product Benchmarking
Table 116: Perspective Therapeutics, Inc.: Strategic Outlook
Table 117: Curium Holding France S.A.S: Key Details
List of Figures
Figure 1 Radiopharmaceutical Therapies Market Segmentation
Figure 2 Radiopharmaceutical Therapies Market by Radioisotope Type: Market Attractiveness Index
Figure 3 Radiopharmaceutical Therapies Market by Therapy Type: Market Attractiveness Index
Figure 4 Radiopharmaceutical Therapies Market by Indication: Market Attractiveness Index
Figure 5 Radiopharmaceutical Therapies Market by End-user: Market Attractiveness Index
Figure 6 Radiopharmaceutical Therapies Market Attractiveness Index by Region
Figure 7 Radiopharmaceutical Therapies Market: Market Dynamics
Figure 8 Radiopharmaceutical Therapies Market: Impact Analysis
Figure 9 Radiopharmaceutical Therapies Market by Region, 2026-2036 (US$ Million, AGR %), Tariff Impact: V-Shaped Recovery Scenario
Figure 10 Radiopharmaceutical Therapies Market by Region, 2026-2036 (US$ Million, AGR %), Tariff Impact: U-Shaped Recovery Scenario
Figure 11 Radiopharmaceutical Therapies Market by Region, 2026-2036 (US$ Million, AGR %), Tariff Impact: L-Shaped Recovery Scenario
Figure 12 Radiopharmaceutical Therapies Market: Porter’s Five Forces Analysis
Figure 13 Radiopharmaceutical Therapies Market: PEST Analysis
Figure 14 Radiopharmaceutical Therapies Market by Radioisotope Type: Market Attractiveness Index
Figure 15 Radiopharmaceutical Therapies Market Forecast by Radioisotope Type, 2026-2036 (US$ Million, AGR %)
Figure 16 Radiopharmaceutical Therapies Market Share Forecast by Radioisotope Type, 2026, 2030, 2036 (%)
Figure 17 Lutetium-177 Segment Market Forecast by Region, 2026-2036 (US$ Million, AGR %)
Figure 18 Lutetium-177 Segment Market Share Forecast by Region, 2026 & 2036 (%)
Figure 19 Actinium-225 Segment Market Forecast by Region, 2026-2036 (US$ Million, AGR %)
Figure 20 Actinium-225 Segment Market Share Forecast by Region, 2026 & 2036 (%)
Figure 21 Yttrium-90 Segment Market Forecast by Region, 2026-2036 (US$ Million, AGR %)
Figure 22 Yttrium-90 Segment Market Share Forecast by Region, 2026 & 2036 (%)
Figure 23 Iodine-131 Segment Market Forecast by Region, 2026-2036 (US$ Million, AGR %)
Figure 24 Iodine-131 Segment Market Share Forecast by Region, 2026 & 2036 (%)
Figure 25 Radium-223 Segment Market Forecast by Region, 2026-2036 (US$ Million, AGR %)
Figure 26 Radium-223 Segment Market Share Forecast by Region, 2026 & 2036 (%)
Figure 27 Others Segment Market Forecast by Region, 2026-2036 (US$ Million, AGR %)
Figure 28 Others Segment Market Share Forecast by Region, 2026 & 2036 (%)
Figure 29 Radiopharmaceutical Therapies Market by Therapy Type: Market Attractiveness Index
Figure 30 Radiopharmaceutical Therapies Market Forecast by Therapy Type, 2026-2036 (US$ Million, AGR %)
Figure 31 Radiopharmaceutical Therapies Market Share Forecast by Therapy Type, 2026, 2030, 2036 (%)
Figure 32 Non-PRRT Radioligand Therapy (RLT) Segment Market Forecast by Region, 2026-2036 (US$ Million, AGR %)
Figure 33 Non-PRRT Radioligand Therapy (RLT) Segment Market Share Forecast by Region, 2026 & 2036
Figure 34 Peptide Receptor Radionuclide Therapy (PRRT) Segment Market Forecast by Region, 2026-2036 (US$ Million, AGR %)
Figure 35 Peptide Receptor Radionuclide Therapy (PRRT) Segment Market Share Forecast by Region, 2026 & 2036 (%)
Figure 36 Targeted Alpha Therapy (TAT) Segment Market Forecast by Region, 2026-2036 (US$ Million, AGR %)
Figure 37 Targeted Alpha Therapy (TAT) Segment Market Share Forecast by Region, 2026 & 2036 (%)
Figure 38 Radioimmunotherapy Segment Market Forecast by Region, 2026-2036 (US$ Million, AGR %)
Figure 39 Radioimmunotherapy Segment Market Share Forecast by Region, 2026 & 2036 (%)
Figure 40 Brachytherapy & Others Segment Market Forecast by Region, 2026-2036 (US$ Million, AGR %)
Figure 41 Brachytherapy & Others Segment Market Share Forecast by Region, 2026 & 2036 (%)
Figure 42 Radiopharmaceutical Therapies Market by Indication: Market Attractiveness Index
Figure 43 Radiopharmaceutical Therapies Market Forecast by Indication, 2026-2036 (US$ Million, AGR %)
Figure 44 Radiopharmaceutical Therapies Market Share Forecast by Indication, 2026, 2030, 2036 (%)
Figure 45 Prostate Cancer Segment Market Forecast by Region, 2026-2036 (US$ Million, AGR %)
Figure 46 Prostate Cancer Segment Market Share Forecast by Region, 2026 & 2036 (%)
Figure 47 Neuroendocrine Tumors (NETs) Segment Market Forecast by Region, 2026-2036 (US$ Million, AGR %)
Figure 48 Neuroendocrine Tumors (NETs) Segment Market Share Forecast by Region, 2026 & 2036 (%)
Figure 49 Thyroid Cancer Segment Market Forecast by Region, 2026-2036 (US$ Million, AGR %)
Figure 50 Thyroid Cancer Segment Market Share Forecast by Region, 2026 & 2036 (%)
Figure 51 Lymphoma Segment Market Forecast by Region, 2026-2036 (US$ Million, AGR %)
Figure 52 Lymphoma Segment Market Share Forecast by Region, 2026 & 2036 (%)
Figure 53 Bone Metastases Segment Market Forecast by Region, 2026-2036 (US$ Million, AGR %)
Figure 54 Bone Metastases Segment Market Share Forecast by Region, 2026 & 2036 (%)
Figure 55 Others Segment Market Forecast by Region, 2026-2036 (US$ Million, AGR %)
Figure 56 Others Segment Market Share Forecast by Region, 2026 & 2036 (%)
Figure 57 Radiopharmaceutical Therapies Market by End-user: Market Attractiveness Index
Figure 58 Radiopharmaceutical Therapies Market Forecast by End-user 2026-2036 (US$ Million, AGR %)
Figure 59 Radiopharmaceutical Therapies Market Share Forecast by End-user, 2026, 2030, 2036 (%)
Figure 60 Hospitals Oncology Segment Market Forecast by Region, 2026-2036 (US$ Million, AGR %)
Figure 61 Hospitals Segment Market Share Forecast by Region, 2026 & 2036 (%)
Figure 62 Specialty & Comprehensive Cancer Centers Segment Market Forecast by Region, 2026-2036 (US$ Million, AGR%, CAGR%)
Figure 63 Specialty & Comprehensive Cancer Centers Segment Market Forecast by Region, 2026-2036 (US$ Million, AGR %)
Figure 64 Specialty & Comprehensive Cancer Centers Segment Market Share Forecast by Region, 2026 & 2036 (%)
Figure 65 Diagnostic & Nuclear Medicine Imaging Centers Segment Market Forecast by Region, 2026-2036 (US$ Million, AGR %)
Figure 66 Diagnostic & Nuclear Medicine Imaging Centers Segment Market Share Forecast by Region, 2026 & 2036 (%)
Figure 67 Other Segment Market Forecast by Region, 2026-2036 (US$ Million, AGR %)
Figure 68 Other Segment Market Share Forecast by Region, 2026 & 2036 (%)
Figure 69 Radiopharmaceutical Therapies Market Forecast by Region 2026 and 2036 (Revenue, CAGR %)
Figure 70 Radiopharmaceutical Therapies Market Share Forecast by Region 2026, 2030, 2036 (%)
Figure 71 Radiopharmaceutical Therapies Market by Region, 2026-2036 (US$ Million, AGR %)
Figure 72 North America Radiopharmaceutical Therapies Market Attractiveness Index
Figure 73 North America Radiopharmaceutical Therapies Market by Region, 2026, 2031 & 2036 (US$ Million)
Figure 74 North America Radiopharmaceutical Therapies Market Forecast by Country, 2026-2036 (US$ Million, AGR %)
Figure 75 North America Radiopharmaceutical Therapies Market Share Forecast by Country, 2026 & 2036 (%)
Figure 76 North America Radiopharmaceutical Therapies Market Forecast by Radioisotope Type, 2026-2036 (US$ Million, AGR %)
Figure 77 North America Radiopharmaceutical Therapies Market Share Forecast by Country, 2026 & 2036 (%)
Figure 78 North America Radiopharmaceutical Therapies Market Forecast by Therapy Type, 2026-2036 (US$ Million, AGR%, CAGR%)
Figure 79 North America Radiopharmaceutical Therapies Market Forecast by Therapy Type, 2026-2036 (US$ Million, AGR %)
Figure 80 North America Radiopharmaceutical Therapies Market Share Forecast by Therapy Type, 2026 & 2036 (%)
Figure 81 North America Radiopharmaceutical Therapies Market Forecast by Indication, 2026-2036 (US$ Million, AGR %)
Figure 82 North America Radiopharmaceutical Therapies Market Share Forecast by Indication, 2026 & 2036 (%)
Figure 83 North America Radiopharmaceutical Therapies Market Forecast by End-users, 2026-2036 (US$ Million, AGR %)
Figure 84 North America Radiopharmaceutical Therapies Market Share Forecast by End-users, 2026 & 2036 (%)
Figure 85 U.S. Radiopharmaceutical Therapies Market Forecast, 2026-2036 (US$ Million, AGR %)
Figure 86 Canada Radiopharmaceutical Therapies Market Forecast, 2026-2036 (US$ Million, AGR%, CAGR %)
Figure 87 Canada Radiopharmaceutical Therapies Market Forecast, 2026-2036 (US$ Million, AGR %)
Figure 88 Europe Radiopharmaceutical Therapies Market Attractiveness Index
Figure 89 Europe Radiopharmaceutical Therapies Market by Region, 2026, 2031 & 2036 (US$ Million)
Figure 90 Europe Radiopharmaceutical Therapies Market Forecast by Country, 2026-2036 (US$ Million, AGR %)
Figure 91 Europe Radiopharmaceutical Therapies Market Share Forecast by Country, 2026 & 2036 (%)
Figure 92 Europe Radiopharmaceutical Therapies Market Forecast by Radioisotope Type, 2026-2036 (US$ Million, AGR %)
Figure 93 Europe Radiopharmaceutical Therapies Market Share Forecast by Country, 2026 & 2036 (%)
Figure 94 Europe Radiopharmaceutical Therapies Market Forecast by Therapy Type, 2026-2036 (US$ Million, AGR %)
Figure 95 Europe Radiopharmaceutical Therapies Market Share Forecast by Therapy Type, 2026 & 2036 (%)
Figure 96 Europe Radiopharmaceutical Therapies Market Forecast by Indication, 2026-2036 (US$ Million, AGR %)
Figure 97 Europe Radiopharmaceutical Therapies Market Share Forecast by Indication, 2026 & 2036 (%)
Figure 98 Europe Radiopharmaceutical Therapies Market Forecast by End-users, 2026-2036 (US$ Million, AGR %)
Figure 99 Europe Radiopharmaceutical Therapies Market Share Forecast by End-users, 2026 & 2036 (%)
Figure 100 Germany Radiopharmaceutical Therapies Market Forecast, 2026-2036 (US$ Million, AGR %)
Figure 101 France Radiopharmaceutical Therapies Market Forecast, 2026-2036 (US$ Million, AGR %)
Figure 102 UK Radiopharmaceutical Therapies Market Forecast, 2026-2036 (US$ Million, AGR %)
Figure 103 Italy Radiopharmaceutical Therapies Market Forecast, 2026-2036 (US$ Million, AGR %)
Figure 104 Spain Radiopharmaceutical Therapies Market Forecast, 2026-2036 (US$ Million, AGR %)
Figure 105 Switzerland Radiopharmaceutical Therapies Market Forecast, 2026-2036 (US$ Million, AGR %)
Figure 106 Poland Radiopharmaceutical Therapies Market Forecast, 2026-2036 (US$ Million, AGR %)
Figure 107 Belgium Radiopharmaceutical Therapies Market Forecast, 2026-2036 (US$ Million, AGR %)
Figure 108 Netherlands Radiopharmaceutical Therapies Market Forecast, 2026-2036 (US$ Million, AGR %)
Figure 109 Rest of Europe Radiopharmaceutical Therapies Market Forecast, 2026-2036 (US$ Million, AGR %)
Figure 110 Asia Pacific Radiopharmaceutical Therapies Market Attractiveness Index
Figure 111 Asia Pacific Radiopharmaceutical Therapies Market by Region, 2026, 2031 & 2036 (US$ Million)
Figure 112 Asia Pacific Radiopharmaceutical Therapies Market Forecast by Country, 2026-2036 (US$ Million, AGR %)
Figure 113 Asia Pacific Radiopharmaceutical Therapies Market Share Forecast by Country, 2026 & 2036 (%)
Figure 114 Asia Pacific Radiopharmaceutical Therapies Market Forecast by Radioisotope Type, 2026-2036 (US$ Million, AGR %)
Figure 115 Asia Pacific Radiopharmaceutical Therapies Market Share Forecast by Country, 2026 & 2036 (%)
Figure 116 Asia Pacific Radiopharmaceutical Therapies Market Forecast by Therapy Type, 2026-2036 (US$ Million, AGR %)
Figure 117 Asia Pacific Radiopharmaceutical Therapies Market Share Forecast by Therapy Type, 2026 & 2036 (%)
Figure 118 Asia Pacific Radiopharmaceutical Therapies Market Forecast by Indication, 2026-2036 (US$ Million, AGR %)
Figure 119 Asia Pacific Radiopharmaceutical Therapies Market Share Forecast by Indication, 2026 & 2036 (%)
Figure 120 Asia Pacific Radiopharmaceutical Therapies Market Forecast by End-users, 2026-2036 (US$ Million, AGR %)
Figure 121 Asia Pacific Radiopharmaceutical Therapies Market Share Forecast by End-users, 2026 & 2036 (%)
Figure 122 China Radiopharmaceutical Therapies Market Forecast, 2026-2036 (US$ Million, AGR %)
Figure 123 Japan Radiopharmaceutical Therapies Market Forecast, 2026-2036 (US$ Million, AGR %)
Figure 124 India Radiopharmaceutical Therapies Market Forecast, 2026-2036 (US$ Million, AGR %)
Figure 125 South Korea Radiopharmaceutical Therapies Market Forecast, 2026-2036 (US$ Million, AGR %)
Figure 126 Australia Radiopharmaceutical Therapies Market Forecast, 2026-2036 (US$ Million, AGR %)
Figure 127 Rest of Asia Pacific Radiopharmaceutical Therapies Market Forecast, 2026-2036 (US$ Million, AGR %)
Figure 128 Latin America Radiopharmaceutical Therapies Market Attractiveness Index
Figure 129 Latin America Radiopharmaceutical Therapies Market by Region, 2026, 2031 & 2036 (US$ Million)
Figure 130 Latin America Radiopharmaceutical Therapies Market Forecast by Country, 2026-2036 (US$ Million, AGR %)
Figure 131 Latin America Radiopharmaceutical Therapies Market Share Forecast by Country, 2026 & 2036 (%)
Figure 132 Latin America Radiopharmaceutical Therapies Market Forecast by Radioisotope Type, 2026-2036 (US$ Million, AGR %)
Figure 133 Latin America Radiopharmaceutical Therapies Market Share Forecast by Country, 2026 & 2036 (%)
Figure 134 Latin America Radiopharmaceutical Therapies Market Forecast by Therapy Type, 2026-2036 (US$ Million, AGR %)
Figure 135 Latin America Radiopharmaceutical Therapies Market Share Forecast by Therapy Type, 2026 & 2036 (%)
Figure 136 Latin America Radiopharmaceutical Therapies Market Forecast by Indication, 2026-2036 (US$ Million, AGR %)
Figure 137 Latin America Radiopharmaceutical Therapies Market Share Forecast by Indication, 2026 & 2036 (%)
Figure 138 Latin America Radiopharmaceutical Therapies Market Forecast by End-users, 2026-2036 (US$ Million, AGR %)
Figure 139 Latin America Radiopharmaceutical Therapies Market Share Forecast by End-users, 2026 & 2036 (%)
Figure 140 Brazil Radiopharmaceutical Therapies Market Forecast, 2026-2036 (US$ Million, AGR %)
Figure 141 Mexico Radiopharmaceutical Therapies Market Forecast, 2026-2036 (US$ Million, AGR %)
Figure 142 Rest of Latin America Radiopharmaceutical Therapies Market Forecast, 2026-2036 (US$ Million, AGR %)
Figure 143 MEA Radiopharmaceutical Therapies Market Attractiveness Index
Figure 144 MEA Radiopharmaceutical Therapies Market by Region, 2026, 2031 & 2036 (US$ Million)
Figure 145 MEA Radiopharmaceutical Therapies Market Forecast by Country, 2026-2036 (US$ Million, AGR %)
Figure 146 MEA Radiopharmaceutical Therapies Market Share Forecast by Country, 2026 & 2036 (%)
Figure 147 MEA Radiopharmaceutical Therapies Market Forecast by Radioisotope Type, 2026-2036 (US$ Million, AGR %)
Figure 148 MEA Radiopharmaceutical Therapies Market Share Forecast by Country, 2026 & 2036 (%)
Figure 149 MEA Radiopharmaceutical Therapies Market Forecast by Therapy Type, 2026-2036 (US$ Million, AGR %)
Figure 150 MEA Radiopharmaceutical Therapies Market Share Forecast by Therapy Type, 2026 & 2036 (%)
Figure 151 MEA Radiopharmaceutical Therapies Market Forecast by Indication, 2026-2036 (US$ Million, AGR %)
Figure 152 MEA Radiopharmaceutical Therapies Market Share Forecast by Indication, 2026 & 2036 (%)
Figure 153 MEA Radiopharmaceutical Therapies Market Forecast by End-users, 2026-2036 (US$ Million, AGR %)
Figure 154 MEA Radiopharmaceutical Therapies Market Share Forecast by End-users, 2026 & 2036 (%)
Figure 155 GCC Radiopharmaceutical Therapies Market Forecast, 2026-2036 (US$ Million, AGR %)
Figure 156 South Africa Radiopharmaceutical Therapies Market Forecast, 2026-2036 (US$ Million, AGR %)
Figure 157 Egypt Radiopharmaceutical Therapies Market Forecast, 2026-2036 (US$ Million, AGR %)
Figure 158 Rest of MEA Radiopharmaceutical Therapies Market Forecast, 2026-2036 (US$ Million, AGR %)
Figure 159 Novartis AG: Net Revenue, 2021-2025 (US$ Million, AGR%)
Figure 160 Novartis AG: R&D, 2021-2025 (US$ Million, AGR%)
Figure 161 Novartis AG: Regional Market Shares, 2025
Figure 162 Novartis AG: Business Segment Market Shares, 2025
Figure 163 Lantheus Holdings, Inc.: Net Revenue, 2021-2025 (US$ Million, AGR%)
Figure 164 Lantheus Holdings, Inc.: R&D, 2021-2025 (US$ Million, AGR%)
Figure 165 Lantheus Holdings, Inc.: Regional Market Shares, 2025
Figure 166 Lantheus Holdings, Inc.: Business Segment Market Shares, 2025
Figure 167 Bayer AG: Net Revenue, 2021-2025 (US$ Million, AGR%)
Figure 168 Bayer AG: R&D, 2021-2025 (US$ Million, AGR%)
Figure 169 Bayer AG: Regional Market Shares, 2025
Figure 170 Bayer AG: Business Segment Market Shares, 2025
Figure 171 Eli Lilly and Company: Net Revenue, 2021-2025 (US$ Million, AGR%)
Figure 172 Eli Lilly and Company: R&D, 2021-2025 (US$ Million, AGR%)
Figure 173 Eli Lilly and Company: Regional Market Shares, 2025
Figure 174 Eli Lilly and Company: Business Segment Market Shares, 2025
Figure 175 Telix Pharmaceuticals Limited: Net Revenue, 2021-2025 (US$ Million, AGR%)
Figure 176 Telix Pharmaceuticals Limited: R&D, 2021-2025 (US$ Million, AGR%)
Figure 177 Telix Pharmaceuticals Limited: Regional Market Shares, 2025
Figure 178 Telix Pharmaceuticals Limited: Business Segment Market Shares, 2025
Figure 179 GE HealthCare Technologies Inc.: Net Revenue, 2021-2025 (US$ Million, AGR%)
Figure 180 GE HealthCare Technologies Inc.: Regional Market Shares, 2025
Figure 181 GE HealthCare Technologies Inc.: Business Segment Market Shares, 2025
Figure 182 Siemens Healthineers AG: Net Revenue, 2021-2025 (US$ Million, AGR%)
Figure 183 Siemens Healthineers AG: Regional Market Shares, 2025
Figure 184 Siemens Healthineers AG: Business Segment Market Shares, 2025
Figure 185 Cardinal Health, Inc.: Net Revenue, 2021-2025 (US$ Million, AGR%)
Figure 186 Cardinal Health, Inc.: Regional Market Shares, 2025
Figure 187 Cardinal Health, Inc.: Business Segment Market Shares, 2025
Figure 188 Clarity Pharmaceuticals Ltd.: Net Revenue, 2021-2025 (US$ Million, AGR%)
Figure 189 Clarity Pharmaceuticals Ltd.: R&D, 2021-2025 (US$ Million, AGR%)
Figure 190 Actinium Pharmaceuticals, Inc.: Net Revenue, 2021-2025 (US$ Million, AGR%)
Figure 191 Actinium Pharmaceuticals, Inc.: Regional Market Shares, 2025
Figure 192 Perspective Therapeutics, Inc.: Net Revenue, 2021-2025 (US$ Million, AGR%)
Figure 193 Perspective Therapeutics, Inc.: R&D, 2021-2025 (US$ Million, AGR%)
Figure 194 Perspective Therapeutics, Inc.: Business Segment Market Shares, 2025
Figure 195 Eckert & Ziegler: Net Revenue, 2021-2025 (US$ Million, AGR%)
Figure 196 Eckert & Ziegler: R&D, 2021-2025 (US$ Million, AGR%)
Figure 197 Eckert & Ziegler: Business Segment Market Shares, 2025
Figure 198 Bristol-Myers Squibb Company: Net Revenue, 2021-2025 (US$ Million, AGR%)
Figure 199 Bristol-Myers Squibb Company: R&D, 2021-2025 (US$ Million, AGR%)
Figure 200 Bristol-Myers Squibb Company: Business Segment Market Shares, 2025
ページTOPに戻る
Summary
Description
Visiongain has published a new report, Radiopharmaceutical Therapies Market Report 2026-2036. The global radiopharmaceutical therapies market is valued at US$7.65bn in 2026 and is forecast to reach US$31.65bn by 2036, at a CAGR of 15.3% over the forecast period.
This report provides a comprehensive analysis of the global radiopharmaceutical therapies market, covering radioisotope type, therapy type, indication and end-user segments. It includes regional and national demand forecasts, competitive landscape assessments, and profiles of the leading companies shaping the market, together with an in-depth analysis of the impact of U.S. trade tariffs on sourcing and manufacturing economics.
Actinium-225 Clinical Advances and Supply Expansion Support Market Growth
Investment in actinium-225 therapies is increasing as developers seek to expand treatment options beyond established beta-emitting platforms. Targeted alpha therapy is forecast to be the fastest-growing therapy segment over the forecast period, driven by an advancing clinical pipeline and growing confidence in the potential of alpha-emitter treatments to address settings where existing options have limited efficacy.
Clinical progress is strengthening the investment case for leading alpha therapy candidates. In October 2026, Bristol Myers Squibb reported that RYZ101 (225Ac-DOTATATE) met its primary progression-free survival endpoint at the interim analysis of the Phase III ACTION-1 trial, evaluating patients with gastroenteropancreatic neuroendocrine tumours whose disease had progressed following lutetium-177-based therapy. The result supports its potential to address an important treatment gap and provides late-stage evidence for actinium-225-based treatment.
The progression of these programmes is increasing the importance of dependable isotope supply. In May 2026, TerraPower Isotopes began construction of a US$450 million actinium-225 manufacturing facility in Philadelphia, intended to ease supply constraints and provide the production capacity needed to support clinical development and potential commercial launches across the pipeline.
Regulatory and Manufacturing Compliance Requirements to Constrain Market Expansion
Expanding radiopharmaceutical production requires manufacturers to meet pharmaceutical quality and radiation safety requirements within tightly controlled production and delivery schedules. Good Manufacturing Practice compliance, specialised quality control and radioactive-material licensing require sustained investment across the supply chain. Differences in national licensing procedures add complexity for companies establishing facilities or supplying multiple markets.
The cost of compliance infrastructure, together with the time required to qualify facilities and obtain authorisations, can delay operational readiness and raise the investment needed to enter the market or expand production. This is illustrated by ITM’s August 2026 Complete Response Letter for 177Lu-edotreotide, in which the FDA cited chemistry, manufacturing and controls issues and third-party commercial facility inspection findings, with no clinical safety or efficacy concerns raised. While efforts to simplify licensing – such as the U.S. NRC’s May 2026 proposed amendments to its byproduct-material licensing framework – could ease selected administrative requirements, manufacturers must continue to account for the full compliance burden when planning new facilities and assessing market entry timelines.
Report Scope and Data Coverage
-
Market revenue forecasts from 2026 to 2036 at global, regional, national and segment level
-
Quantitative analysis by radioisotope type, therapy type, indication and end user
-
Regional forecasts for North America, Europe, Asia-Pacific, Latin America and Middle East & Africa
-
National-level forecasts for 21 markets including the U.S., Canada, Germany, UK, France, Italy, Spain, Switzerland, Poland, Belgium, Netherlands, Japan, China, India, Australia, South Korea, Brazil, Mexico, GCC, South Africa and Egypt
-
Profiles of 25 leading companies including financial performance, strategy and recent developments
-
In-depth analysis of the impact of U.S. Section 232 tariffs on radiopharmaceutical sourcing and manufacturing economics
-
Analysis of market drivers, restraints, opportunities and competitive dynamics
Segmentation Framework
By Radioisotope Type
-
Lutetium-177
-
Actinium-225
-
Yttrium-90
-
Iodine-131
-
Radium-223
-
Others
By Therapy Type
-
Non-PRRT Radioligand Therapy (RLT)
-
Peptide Receptor Radionuclide Therapy (PRRT)
-
Targeted Alpha Therapy (TAT)
-
Radioimmunotherapy
-
Brachytherapy & Others
By Indication
-
Prostate Cancer
-
Neuroendocrine Tumors (NETs)
-
Thyroid Cancer
-
Lymphoma
-
Bone Metastases
-
Others
By End User
-
Hospitals
-
Specialty & Comprehensive Cancer Centers
-
Diagnostic & Nuclear Medicine Imaging Centers
-
Others
Geographic Coverage
North America
Europe
-
Germany
-
UK
-
France
-
Italy
-
Spain
-
Switzerland
-
Poland
-
Belgium
-
Netherlands
Asia-Pacific
-
Japan
-
China
-
India
-
Australia
-
South Korea
Latin America
Middle East & Africa
Company Intelligence Coverage
Visiongain profiles 25 leading companies operating across the radiopharmaceutical therapies market, covering radioisotope producers, therapy developers, contract manufacturers and diagnostics firms.
-
Actinium Pharmaceuticals, Inc.
-
ARTBIO, Inc.
-
AdvanCell Pty Ltd.
-
Ariceum Therapeutics
-
Bayer AG
-
Bracco Imaging S.p.A.
-
Bristol Myers Squibb Company (RayzeBio)
-
Cardinal Health, Inc.
-
Clarity Pharmaceuticals Ltd.
-
Convergent Therapeutics, Inc.
-
Curium Holding France S.A.S
-
Eckert & Ziegler
-
Eli Lilly and Company
-
Fusion Pharmaceuticals Inc. (AstraZeneca)
-
GE HealthCare Technologies Inc.
-
ITM Isotope Technologies Munich SE
-
Lantheus Holdings, Inc.
-
NorthStar Medical Technologies, LLC (NorthStar)
-
Novartis AG
-
Orano Med
-
Perspective Therapeutics, Inc.
-
RadioMedix, Inc.
-
Ratio Therapeutics, Inc.
-
Siemens Healthineers AG
-
Telix Pharmaceuticals Limited
Each profile includes:
-
Corporate overview and strategic positioning
-
Radiopharmaceutical portfolio and pipeline status
-
Key partnerships, manufacturing arrangements and regulatory milestones
-
Recent developments and competitive outlook
Key Questions Answered
-
What is the current and projected size of the global radiopharmaceutical therapies market?
-
Which radioisotope types, therapy types and indications are growing fastest?
-
Which end-user channels and geographies offer the greatest commercial opportunity?
-
How are U.S. Section 232 tariffs affecting radiopharmaceutical sourcing and manufacturing decisions?
-
How will advances in actinium-225 and lead-212 therapies reshape the competitive landscape?
-
Who are the leading companies and how are they positioning through supply chain investments and partnerships?
-
What are the primary regulatory and compliance constraints on market expansion?
-
How will ANDA-based entrants and late-stage pipeline candidates affect competition in established indications?
ページTOPに戻る
Table of Contents
1 Report Overview
1.1 Objectives of the Study
1.2 Introduction to Radiopharmaceutical Therapies Market
1.3 What This Report Delivers
1.4 Why You Should Read This Report
1.5 Key Questions Answered by This Analytical Report
1.6 Who is This Report for?
1.7 Methodology
1.7.1 Market Definitions
1.7.2 Market Evaluation & Forecasting Methodology
1.7.3 Data Validation
1.7.3.1 Primary Research
1.7.3.2 Secondary Research
1.8 Frequently Asked Questions (FAQs)
1.9 Associated Visiongain Reports
1.10 About Visiongain
2 Executive Summary
3 Market Overview
3.1 Key Findings
3.2 Market Dynamics
3.3 Impact Analysis
3.3.1 Market Driving Factors
3.3.1.1 Rising Global Cancer Incidence and Demand for Targeted Therapies
3.3.1.2 Growing Clinical and Regulatory Momentum for Radioligand Therapy (RLT)
3.3.1.3 Expansion of Theranostics Adoption
3.3.1.4 Increasing Investment in Novel Isotope Production Capacity
3.3.2 Market Restraining Factors
3.3.2.1 Short Half-Life and Radioisotope Supply Chain Complexities
3.3.2.2 High Cost of Treatment and Reimbursement Challenges
3.3.2.3 GMP Manufacturing and Distribution Infrastructure Constraints
3.3.2.4 Radiation Safety, Handling and Regulatory Compliance Burden
3.3.3 Market Opportunities
3.3.3.1 Emerging Alpha-Emitter Pipeline (Actinium-225, Lead-212)
3.3.3.2 Expansion into New Solid Tumour Indications
3.3.3.3 Distributed Radiopharmacy Preparation and Regional Distribution
3.3.3.4 Strategic CDMO and Isotope-Supply Partnerships
3.4 Market Trends
3.5 U.S. Tariffs: What’s the Impact on Global Radiopharmaceutical Therapies Market?
3.5.1 Overview
3.5.2 V-Shaped Recovery Scenario
3.5.2.1 Why V-Shaped Recovery?
3.5.2.2 Impact from Tariffs
3.5.2.3 Market Dynamics and Demand Recovery
3.5.2.4 Policy and Funding Support
3.5.2.5 Timeframe for Recovery
3.5.3 U-Shaped Recovery Scenario
3.5.3.1 Why U-Shaped Recovery?
3.5.3.2 Impact from Tariffs
3.5.3.3 Market Dynamics and Demand Recovery
3.5.3.4 Policy and Funding Support
3.5.3.5 Timeframe for Recovery
3.5.4 L-Shaped Recovery Scenario
3.5.4.1 Why L-Shaped Recovery?
3.5.4.2 Impact from Tariffs
3.5.4.3 Market Dynamics and Demand Recovery
3.5.4.4 Policy and Funding Support
3.5.4.5 Timeframe for Recovery
3.5.5 What Strategic Considerations Should Clients Factor into Their Near-term (2026-2031) and Long-term (2026-2036) Planning?
3.5.6 Impact of the U.S. and China Trade War on Radiopharmaceutical Therapies Market
3.6 SWOT Analysis
3.6.1 Strengths
3.6.2 Weaknesses
3.6.3 Opportunities
3.6.4 Threats
3.7 Porter’s Five Forces Analysis
3.7.1 Bargaining Power of Suppliers (Low to Medium)
3.7.2 Bargaining Power of Buyers (Low)
3.7.3 Competitive Rivalry (High)
3.7.4 Threat from Substitutes (Low)
3.7.5 Threat of New Entrants (Low to Medium)
3.8 PEST Analysis
3.9 Supply Chain Analysis
3.9.1 Supply Chain Flow
3.9.2 Key Trends Impacting Supply Chain
4 Radiopharmaceutical Therapies Market Analysis by Radioisotope Type
4.1 Key Findings
4.2 Radioisotope Type Segment: Market Attractiveness Index
4.3 Radiopharmaceutical Therapies Market Size Estimation and Forecast by Radioisotope Type
4.4 Lutetium-177
4.4.1 Market Size by Region, 2026-2036 (US$ Million)
4.4.2 Market Share by Region, 2026 & 2036 (%)
4.5 Actinium-225
4.5.1 Market Size by Region, 2026-2036 (US$ Million)
4.5.2 Market Share by Region, 2026 & 2036 (%)
4.6 Yttrium-90
4.6.1 Market Size by Region, 2026-2036 (US$ Million)
4.6.2 Market Share by Region, 2026 & 2036 (%)
4.7 Iodine-131
4.7.1 Market Size by Region, 2026-2036 (US$ Million)
4.7.2 Market Share by Region, 2026 & 2036 (%)
4.8 Radium-223
4.8.1 Market Size by Region, 2026-2036 (US$ Million)
4.8.2 Market Share by Region, 2026 & 2036 (%)
4.9 Others
4.9.1 Market Size by Region, 2026-2036 (US$ Million)
4.9.2 Market Share by Region, 2026 & 2036 (%)
5 Radiopharmaceutical Therapies Market Analysis by Therapy Type
5.1 Key Findings
5.2 Therapy Type Segment: Market Attractiveness Index
5.3 Radiopharmaceutical Therapies Market Size Estimation and Forecast by Therapy Type
5.4 Non-PRRT Radioligand Therapy (RLT)
5.4.1 Market Size by Region, 2026-2036 (US$ Million)
5.4.2 Market Share by Region, 2026 & 2036 (%)
5.5 Peptide Receptor Radionuclide Therapy (PRRT)
5.5.1 Market Size by Region, 2026-2036 (US$ Million)
5.5.2 Market Share by Region, 2026 & 2036 (%)
5.6 Targeted Alpha Therapy (TAT)
5.6.1 Market Size by Region, 2026-2036 (US$ Million)
5.6.2 Market Share by Region, 2026 & 2036 (%)
5.7 Radioimmunotherapy
5.7.1 Market Size by Region, 2026-2036 (US$ Million)
5.7.2 Market Share by Region, 2026 & 2036 (%)
5.8 Brachytherapy & Others
5.8.1 Market Size by Region, 2026-2036 (US$ Million)
5.8.2 Market Share by Region, 2026 & 2036 (%)
6 Radiopharmaceutical Therapies Market Analysis by Indication
6.1 Key Findings
6.2 Indication Segment: Market Attractiveness Index
6.3 Radiopharmaceutical Therapies Market Size Estimation and Forecast by Indication
6.4 Prostate Cancer
6.4.1 Market Size by Region, 2026-2036 (US$ Million)
6.4.2 Market Share by Region, 2026 & 2036 (%)
6.5 Neuroendocrine Tumors (NETs)
6.5.1 Market Size by Region, 2026-2036 (US$ Million)
6.5.2 Market Share by Region, 2026 & 2036 (%)
6.6 Thyroid Cancer
6.6.1 Market Size by Region, 2026-2036 (US$ Million)
6.6.2 Market Share by Region, 2026 & 2036 (%)
6.7 Lymphoma
6.7.1 Market Size by Region, 2026-2036 (US$ Million)
6.7.2 Market Share by Region, 2026 & 2036 (%)
6.8 Bone Metastases
6.8.1 Market Size by Region, 2026-2036 (US$ Million)
6.8.2 Market Share by Region, 2026 & 2036 (%)
6.9 Others
6.9.1 Market Size by Region, 2026-2036 (US$ Million)
6.9.2 Market Share by Region, 2026 & 2036 (%)
7 Radiopharmaceutical Therapies Market Analysis by End-user
7.1 Key Findings
7.2 End-user Segment: Market Attractiveness Index
7.3 Radiopharmaceutical Therapies Market Size Estimation and Forecast by End-users
7.4 Hospitals
7.4.1 Market Size by Region, 2026-2036 (US$ Million)
7.4.2 Market Share by Region, 2026 & 2036 (%)
7.5 Specialty & Comprehensive Cancer Centers
7.5.1 Market Size by Region, 2026-2036 (US$ Million)
7.5.2 Market Share by Region, 2026 & 2036 (%)
7.6 Diagnostic & Nuclear Medicine Imaging Centers
7.6.1 Market Size by Region, 2026-2036 (US$ Million)
7.6.2 Market Share by Region, 2026 & 2036 (%)
7.7 Others
7.7.1 Market Size by Region, 2026-2036 (US$ Million)
7.7.2 Market Share by Region, 2026 & 2036 (%)
8 Radiopharmaceutical Therapies Market Analysis by Region
8.1 Key Findings
8.2 Regional Key Manufacturing Sites
8.3 Regional Market Size Estimation and Forecast
9 North America Radiopharmaceutical Therapies Market Analysis
9.1 Key Findings
9.2 North America Radiopharmaceutical Therapies Market Attractiveness Index
9.3 North America Radiopharmaceutical Therapies Market by Country, 2026, 2031 & 2036 (US$ Million)
9.4 North America Radiopharmaceutical Therapies Market Size Estimation and Forecast by Country
9.5 North America Radiopharmaceutical Therapies Market Size Estimation and Forecast by Radioisotope Type
9.6 North America Radiopharmaceutical Therapies Market Size Estimation and Forecast by Therapy Type
9.7 North America Radiopharmaceutical Therapies Market Size Estimation and Forecast by Indication
9.8 North America Radiopharmaceutical Therapies Market Size Estimation and Forecast by End-users
9.9 U.S. Radiopharmaceutical Therapies Market Analysis
9.10 Canada Radiopharmaceutical Therapies Market Analysis
10 Europe Radiopharmaceutical Therapies Market Analysis
10.1 Key Findings
10.2 Europe Radiopharmaceutical Therapies Market Attractiveness Index
10.3 Europe Radiopharmaceutical Therapies Market by Country, 2026, 2031 & 2036 (US$ Million)
10.4 Europe Radiopharmaceutical Therapies Market Size Estimation and Forecast by Country
10.5 Europe Radiopharmaceutical Therapies Market Size Estimation and Forecast by Radioisotope Type
10.6 Europe Radiopharmaceutical Therapies Market Size Estimation and Forecast by Therapy Type
10.7 Europe Radiopharmaceutical Therapies Market Size Estimation and Forecast by Indication
10.8 Europe Radiopharmaceutical Therapies Market Size Estimation and Forecast by End-users
10.9 Germany Radiopharmaceutical Therapies Market Analysis
10.10 France Radiopharmaceutical Therapies Market Analysis
10.11 UK Radiopharmaceutical Therapies Market Analysis
10.12 Italy Radiopharmaceutical Therapies Market Analysis
10.13 Spain Radiopharmaceutical Therapies Market Analysis
10.14 Switzerland Radiopharmaceutical Therapies Market Analysis
10.15 Poland Radiopharmaceutical Therapies Market Analysis
10.16 Belgium Radiopharmaceutical Therapies Market Analysis
10.17 Netherlands Radiopharmaceutical Therapies Market Analysis
10.18 Rest of Europe Radiopharmaceutical Therapies Market Analysis
11 Asia Pacific Radiopharmaceutical Therapies Market Analysis
11.1 Key Findings
11.2 Asia Pacific Radiopharmaceutical Therapies Market Attractiveness Index
11.3 Asia Pacific Radiopharmaceutical Therapies Market by Country, 2026, 2031 & 2036 (US$ Million)
11.4 Asia Pacific Radiopharmaceutical Therapies Market Size Estimation and Forecast by Country
11.5 Asia Pacific Radiopharmaceutical Therapies Market Size Estimation and Forecast by Radioisotope Type
11.6 Asia Pacific Radiopharmaceutical Therapies Market Size Estimation and Forecast by Therapy Type
11.7 Asia Pacific Radiopharmaceutical Therapies Market Size Estimation and Forecast by Indication
11.8 Asia Pacific Radiopharmaceutical Therapies Market Size Estimation and Forecast by End-users
11.9 China Radiopharmaceutical Therapies Market Analysis
11.10 Japan Radiopharmaceutical Therapies Market Analysis
11.11 India Radiopharmaceutical Therapies Market Analysis
11.12 South Korea Radiopharmaceutical Therapies Market Analysis
11.13 Australia Radiopharmaceutical Therapies Market Analysis
11.14 Rest of Asia Pacific Radiopharmaceutical Therapies Market Analysis
12 Latin America Radiopharmaceutical Therapies Market Analysis
12.1 Key Findings
12.2 Latin America Radiopharmaceutical Therapies Market Attractiveness Index
12.3 Latin America Radiopharmaceutical Therapies Market by Country, 2026, 2031 & 2036 (US$ Million)
12.4 Latin America Radiopharmaceutical Therapies Market Size Estimation and Forecast by Country
12.5 Latin America Radiopharmaceutical Therapies Market Size Estimation and Forecast by Radioisotope Type
12.6 Latin America Radiopharmaceutical Therapies Market Size Estimation and Forecast by Therapy Type
12.7 Latin America Radiopharmaceutical Therapies Market Size Estimation and Forecast by Indication
12.8 Latin America Radiopharmaceutical Therapies Market Size Estimation and Forecast by End-users
12.9 Brazil Radiopharmaceutical Therapies Market Analysis
12.10 Mexico Radiopharmaceutical Therapies Market Analysis
12.11 Rest of Latin America Radiopharmaceutical Therapies Market Analysis
13 MEA Radiopharmaceutical Therapies Market Analysis
13.1 Key Findings
13.2 MEA Radiopharmaceutical Therapies Market Attractiveness Index
13.3 MEA Radiopharmaceutical Therapies Market by Country, 2026, 2031 & 2036 (US$ Million)
13.4 MEA Radiopharmaceutical Therapies Market Size Estimation and Forecast by Country
13.5 MEA Radiopharmaceutical Therapies Market Size Estimation and Forecast by Radioisotope Type
13.6 MEA Radiopharmaceutical Therapies Market Size Estimation and Forecast by Therapy Type
13.7 MEA Radiopharmaceutical Therapies Market Size Estimation and Forecast by Indication
13.8 MEA Radiopharmaceutical Therapies Market Size Estimation and Forecast by End-users
13.9 GCC Radiopharmaceutical Therapies Market Analysis
13.10 South Africa Radiopharmaceutical Therapies Market Analysis
13.11 Egypt Radiopharmaceutical Therapies Market Analysis
13.12 Rest of MEA Radiopharmaceutical Therapies Market Analysis
14 Company Profiles
14.1 Competitive Landscape, 2025
14.2 Strategic Outlook
14.3 Novartis AG
14.3.1 Company Snapshot
14.3.2 Company Overview
14.3.3 Financial Analysis
14.3.3.1 Net Revenue, 2021-2025
14.3.3.2 R&D, 2021-2025
14.3.3.3 Regional Market Shares, 2025
14.3.3.4 Business Segment Market Shares, 2025
14.3.4 Product Benchmarking
14.3.5 Strategic Outlook
14.4 Lantheus Holdings, Inc.
14.4.1 Company Snapshot
14.4.2 Company Overview
14.4.3 Financial Analysis
14.4.3.1 Net Revenue, 2021-2025
14.4.3.2 R&D, 2021-2025
14.4.3.3 Regional Market Shares, 2025
14.4.3.4 Business Segment Market Shares, 2025
14.4.4 Product Benchmarking
14.4.5 Strategic Outlook
14.5 Bayer AG
14.5.1 Company Snapshot
14.5.2 Company Overview
14.5.3 Financial Analysis
14.5.3.1 Net Revenue, 2021-2025
14.5.3.2 R&D, 2021-2025
14.5.3.3 Regional Market Shares, 2025
14.5.3.4 Business Segment Market Shares, 2025
14.5.4 Product Benchmarking
14.5.5 Strategic Outlook
14.6 Eli Lilly and Company
14.6.1 Company Snapshot
14.6.2 Company Overview
14.6.3 Financial Analysis
14.6.3.1 Net Revenue, 2021-2025
14.6.3.2 R&D, 2021-2025
14.6.3.3 Regional Market Shares, 2025
14.6.3.4 Business Segment Market Shares, 2025
14.6.4 Product Benchmarking
14.6.5 Strategic Outlook
14.7 Telix Pharmaceuticals Limited
14.7.1 Company Snapshot
14.7.2 Company Overview
14.7.3 Financial Analysis
14.7.3.1 Net Revenue, 2021-2025
14.7.3.2 R&D, 2021-2025
14.7.3.3 Regional Market Shares, 2025
14.7.3.4 Business Segment Market Shares, 2025
14.7.4 Product Benchmarking
14.7.5 Strategic Outlook
14.8 GE HealthCare Technologies Inc.
14.8.1 Company Snapshot
14.8.2 Company Overview
14.8.3 Financial Analysis
14.8.3.1 Net Revenue, 2021-2025
14.8.3.2 R&D, 2021-2025
14.8.3.3 Regional Market Shares, 2025
14.8.3.4 Business Segment Market Shares, 2025
14.8.4 Product Benchmarking
14.8.5 Strategic Outlook
14.9 Siemens Healthineers AG
14.9.1 Company Snapshot
14.9.2 Company Overview
14.9.3 Financial Analysis
14.9.3.1 Net Revenue, 2021-2025
14.9.3.2 Regional Market Shares, 2025
14.9.3.3 Business Segment Market Shares, 2025
14.9.4 Product Benchmarking
14.9.5 Strategic Outlook
14.10 Cardinal Health, Inc.
14.10.1 Company Snapshot
14.10.2 Company Overview
14.10.3 Financial Analysis
14.10.3.1 Net Revenue, 2021-2025
14.10.3.2 Regional Market Shares, 2025
14.10.3.3 Business Segment Market Shares, 2025
14.10.4 Product Benchmarking
14.10.5 Strategic Outlook
14.11 Clarity Pharmaceuticals Ltd.
14.11.1 Company Snapshot
14.11.2 Company Overview
14.11.3 Financial Analysis
14.11.3.1 Net Revenue, 2021-2025
14.11.3.2 R&D, 2021-2025
14.11.4 Product Benchmarking
14.11.5 Strategic Outlook
14.12 Actinium Pharmaceuticals, Inc.
14.12.1 Company Snapshot
14.12.2 Company Overview
14.12.3 Financial Analysis
14.12.3.1 Net Revenue, 2021-2025
14.12.3.2 Regional Market Shares, 2025
14.12.4 Product Benchmarking
14.12.5 Strategic Outlook
14.13 Perspective Therapeutics, Inc.
14.13.1 Company Snapshot
14.13.2 Company Overview
14.13.3 Financial Analysis
14.13.3.1 Net Revenue, 2021-2025
14.13.3.2 R&D, 2021-2025
14.13.3.3 Business Segment Market Shares, 2025
14.13.4 Product Benchmarking
14.13.5 Strategic Outlook
14.14 Curium Holding France S.A.S
14.14.1 Company Snapshot
14.14.2 Company Overview
14.14.3 Product Benchmarking
14.14.4 Strategic Outlook
14.15 Bracco Imaging S.p.A.
14.15.1 Company Snapshot
14.15.2 Company Overview
14.15.3 Product Benchmarking
14.15.4 Strategic Outlook
14.16 ITM Isotope Technologies Munich SE
14.16.1 Company Snapshot
14.16.2 Company Overview
14.16.3 Product Benchmarking
14.16.4 Strategic Outlook
14.17 Orano Med
14.17.1 Company Snapshot
14.17.2 Company Overview
14.17.3 Product Benchmarking
14.17.4 Strategic Outlook
14.18 RadioMedix, Inc.
14.18.1 Company Snapshot
14.18.2 Company Overview
14.18.3 Product Benchmarking
14.18.4 Strategic Outlook
14.19 Fusion Pharmaceuticals Inc.
14.19.1 Company Snapshot
14.19.2 Company Overview
14.19.3 Product Benchmarking
14.19.4 Strategic Outlook
14.20 ARTBIO, Inc.
14.20.1 Company Snapshot
14.20.2 Company Overview
14.20.3 Product Benchmarking
14.21 AdvanCell Pty Ltd
14.21.1 Company Snapshot
14.21.2 Company Overview
14.21.3 Product Benchmarking
14.22 Ratio Therapeutics, Inc.
14.22.1 Company Snapshot
14.22.2 Company Overview
14.22.3 Product Benchmarking
14.22.4 Strategic Outlook
14.23 Eckert & Ziegler
14.23.1 Company Snapshot
14.23.2 Company Overview
14.23.3 Financial Analysis
14.23.3.1 Net Revenue, 2021-2025
14.23.3.2 R&D, 2021-2025
14.23.3.3 Business Segment Market Shares, 2025
14.23.4 Product Benchmarking
14.23.5 Strategic Outlook
14.24 Bristol-Myers Squibb Company
14.24.1 Company Snapshot
14.24.2 Company Overview
14.24.3 Financial Analysis
14.24.3.1 Net Revenue, 2021-2025
14.24.3.2 R&D, 2021-2025
14.24.3.3 Business Segment Market Shares, 2025
14.24.4 Product Benchmarking
14.24.5 Strategic Outlook
14.25 Convergent Therapeutics, Inc.
14.25.1 Company Snapshot
14.25.2 Company Overview
14.25.3 Product Benchmarking
14.26 Ariceum Therapeutics GmbH
14.26.1 Company Snapshot
14.26.2 Company Overview
14.26.3 Product Benchmarking
14.26.4 Strategic Outlook
14.27 NorthStar Medical Technologies, LLC (NorthStar)
14.27.1 Company Snapshot
14.27.2 Company Overview
14.27.3 Product Benchmarking
15 Conclusion and Recommendations
15.1 Concluding Remarks from Visiongain
15.2 Recommendations for Market Players
ページTOPに戻る
List of Tables/Graphs
List of Tables
Table 1: Radiopharmaceutical Therapies Market Snapshot, 2026 & 2036 (US$ Million, CAGR %)
Table 2: Radiopharmaceutical Therapies Market: Impact Analysis
Table 3: Radiopharmaceutical Therapies Market Forecast by Region, 2026-2036 (US$ Million, AGR%, CAGR%): “V” Shaped Recovery
Table 4: Radiopharmaceutical Therapies Market Forecast by Region, 2026-2036 (US$ Million, AGR%, CAGR%): “U” Shaped Recovery
Table 5: Radiopharmaceutical Therapies Market Forecast by Region, 2026-2036 (US$ Million, AGR%, CAGR%): “L” Shaped Recovery
Table 6: Radiopharmaceutical Therapies Market Forecast by Radioisotope Type, 2026-2036 (US$ Million, AGR%, CAGR%)
Table 7: Lutetium-177 Segment Market Forecast by Region, 2026-2036 (US$ Million, AGR%, CAGR%)
Table 8: Actinium-225 Segment Market Forecast by Region, 2026-2036 (US$ Million, AGR%, CAGR%)
Table 9: Yttrium-90 Segment Market Forecast by Region, 2026-2036 (US$ Million, AGR%, CAGR%)
Table 10: Iodine-131 Segment Market Forecast by Region, 2026-2036 (US$ Million, AGR%, CAGR%)
Table 11: Radium-223 Segment Market Forecast by Region, 2026-2036 (US$ Million, AGR%, CAGR%)
Table 12: Others Segment Market Forecast by Region, 2026-2036 (US$ Million, AGR%, CAGR%)
Table 13: Radiopharmaceutical Therapies Market Forecast by Therapy Type, 2026-2036 (US$ Million, AGR%, CAGR%)
Table 14: Radioligand Therapy (RLT) Segment Market Forecast by Region, 2026-2036 (US$ Million, AGR%, CAGR%)
Table 15: Peptide Receptor Radionuclide Therapy (PRRT) Segment Market Forecast by Region, 2026-2036 (US$ Million, AGR%, CAGR%)
Table 16: Targeted Alpha Therapy (TAT) Segment Market Forecast by Region, 2026-2036 (US$ Million, AGR%, CAGR%)
Table 17: Radioimmunotherapy Segment Market Forecast by Region, 2026-2036 (US$ Million, AGR%, CAGR%)
Table 18: Brachytherapy & Others Segment Market Forecast by Region, 2026-2036 (US$ Million, AGR%, CAGR%)
Table 19: Radiopharmaceutical Therapies Market Forecast by Indication, 2026-2036 (US$ Million, AGR%, CAGR%)
Table 20: Prostate Cancer Segment Market Forecast by Region, 2026-2036 (US$ Million, AGR%, CAGR%)
Table 21: Neuroendocrine Tumors (NETs) Segment Market Forecast by Region, 2026-2036 (US$ Million, AGR%, CAGR%)
Table 22: Thyroid Cancer Segment Market Forecast by Region, 2026-2036 (US$ Million, AGR%, CAGR%)
Table 23: Lymphoma Segment Market Forecast by Region, 2026-2036 (US$ Million, AGR%, CAGR%)
Table 24: Bone Metastases Segment Market Forecast by Region, 2026-2036 (US$ Million, AGR%, CAGR%)
Table 25: Others Segment Market Forecast by Region, 2026-2036 (US$ Million, AGR%, CAGR%)
Table 26: Radiopharmaceutical Therapies Market Forecast by End-user, 2026-2036 (US$ Million, AGR%, CAGR%)
Table 27: Hospitals Segment Market Forecast by Region, 2026-2036 (US$ Million, AGR%, CAGR%)
Table 28: Specialty & Comprehensive Cancer Centers Segment Market Forecast by Region, 2026-2036 (US$ Million, AGR%, CAGR%)
Table 29: Diagnostic & Nuclear Medicine Imaging Centers Segment Market Forecast by Region, 2026-2036 (US$ Million, AGR%, CAGR%)
Table 30: Other Segment Market Forecast by Region, 2026-2036 (US$ Million, AGR%, CAGR%)
Table 31: Radiopharmaceutical Therapies Market: Regional Key Manufacturing Sites
Table 32: Radiopharmaceutical Therapies Market Forecast by Region, 2026-2036 (US$ Million, AGR%, CAGR%)
Table 33: North America Radiopharmaceutical Therapies Market Forecast by Country, 2026-2036 (US$ Million, AGR%, CAGR%)
Table 34: North America Radiopharmaceutical Therapies Market Forecast by Radioisotope Type, 2026-2036 (US$ Million, AGR%, CAGR%)
Table 35: North America Radiopharmaceutical Therapies Market Forecast by Therapy Type, 2026-2036 (US$ Million, AGR%, CAGR%)
Table 36: North America Radiopharmaceutical Therapies Market Forecast by Indication, 2026-2036 (US$ Million, AGR%, CAGR%)
Table 37: North America Radiopharmaceutical Therapies Market Forecast by End-users, 2026-2036 (US$ Million, AGR%, CAGR%)
Table 38: U.S. Radiopharmaceutical Therapies Market Forecast, 2026-2036 (US$ Million, AGR%, CAGR%)
Table 39: Canada Radiopharmaceutical Therapies Market Forecast, 2026-2036 (US$ Million, AGR%, CAGR%)
Table 40: Europe Radiopharmaceutical Therapies Market Forecast by Country, 2026-2036 (US$ Million, AGR%, CAGR%)
Table 41: Europe Radiopharmaceutical Therapies Market Forecast by Radioisotope Type, 2026-2036 (US$ Million, AGR%, CAGR%)
Table 42: Europe Radiopharmaceutical Therapies Market Forecast by Therapy Type, 2026-2036 (US$ Million, AGR%, CAGR%)
Table 43: Europe Radiopharmaceutical Therapies Market Forecast by Indication, 2026-2036 (US$ Million, AGR%, CAGR%)
Table 44: Europe Radiopharmaceutical Therapies Market Forecast by End-users, 2026-2036 (US$ Million, AGR%, CAGR%)
Table 45: Germany Radiopharmaceutical Therapies Market Forecast, 2026-2036 (US$ Million, AGR%, CAGR%)
Table 46: France Radiopharmaceutical Therapies Market Forecast, 2026-2036 (US$ Million, AGR%, CAGR%)
Table 47: UK Radiopharmaceutical Therapies Market Forecast, 2026-2036 (US$ Million, AGR%, CAGR%)
Table 48: Italy Radiopharmaceutical Therapies Market Forecast, 2026-2036 (US$ Million, AGR%, CAGR%)
Table 49: Spain Radiopharmaceutical Therapies Market Forecast, 2026-2036 (US$ Million, AGR%, CAGR%)
Table 50: Switzerland Radiopharmaceutical Therapies Market Forecast, 2026-2036 (US$ Million, AGR%, CAGR%)
Table 51: Poland Radiopharmaceutical Therapies Market Forecast, 2026-2036 (US$ Million, AGR%, CAGR%)
Table 52: Belgium Radiopharmaceutical Therapies Market Forecast, 2026-2036 (US$ Million, AGR%, CAGR%)
Table 53: Netherlands Radiopharmaceutical Therapies Market Forecast, 2026-2036 (US$ Million, AGR%, CAGR%)
Table 54: Rest of Europe Radiopharmaceutical Therapies Market Forecast, 2026-2036 (US$ Million, AGR%, CAGR%)
Table 55: Asia Pacific Radiopharmaceutical Therapies Market Forecast by Country, 2026-2036 (US$ Million, AGR%, CAGR%)
Table 56: Asia Pacific Radiopharmaceutical Therapies Market Forecast by Radioisotope Type, 2026-2036 (US$ Million, AGR%, CAGR%)
Table 57: Asia Pacific Radiopharmaceutical Therapies Market Forecast by Therapy Type, 2026-2036 (US$ Million, AGR%, CAGR%)
Table 58: Asia Pacific Radiopharmaceutical Therapies Market Forecast by Indication, 2026-2036 (US$ Million, AGR%, CAGR%)
Table 59: Asia Pacific Radiopharmaceutical Therapies Market Forecast by End-users, 2026-2036 (US$ Million, AGR%, CAGR%)
Table 60: China Radiopharmaceutical Therapies Market Forecast, 2026-2036 (US$ Million, AGR%, CAGR%)
Table 61: Japan Radiopharmaceutical Therapies Market Forecast, 2026-2036 (US$ Million, AGR%, CAGR%)
Table 62: India Radiopharmaceutical Therapies Market Forecast, 2026-2036 (US$ Million, AGR%, CAGR%)
Table 63: South Korea Radiopharmaceutical Therapies Market Forecast, 2026-2036 (US$ Million, AGR%, CAGR%)
Table 64: Australia Radiopharmaceutical Therapies Market Forecast, 2026-2036 (US$ Million, AGR%, CAGR%)
Table 65: Rest of Asia Pacific Radiopharmaceutical Therapies Market Forecast, 2026-2036 (US$ Million, AGR%, CAGR%)
Table 66: Latin America Radiopharmaceutical Therapies Market Forecast by Country, 2026-2036 (US$ Million, AGR%, CAGR%)
Table 67: Latin America Radiopharmaceutical Therapies Market Forecast by Radioisotope Type, 2026-2036 (US$ Million, AGR%, CAGR%)
Table 68: Latin America Radiopharmaceutical Therapies Market Forecast by Therapy Type, 2026-2036 (US$ Million, AGR%, CAGR%)
Table 69: Latin America Radiopharmaceutical Therapies Market Forecast by Indication, 2026-2036 (US$ Million, AGR%, CAGR%)
Table 70: Latin America Radiopharmaceutical Therapies Market Forecast by End-users, 2026-2036 (US$ Million, AGR%, CAGR%)
Table 71: Brazil Radiopharmaceutical Therapies Market Forecast, 2026-2036 (US$ Million, AGR%, CAGR%)
Table 72: Mexico Radiopharmaceutical Therapies Market Forecast, 2026-2036 (US$ Million, AGR%, CAGR%)
Table 73: Rest of Latin America Radiopharmaceutical Therapies Market Forecast, 2026-2036 (US$ Million, AGR%, CAGR%)
Table 74: MEA Radiopharmaceutical Therapies Market Forecast by Country, 2026-2036 (US$ Million, AGR%, CAGR%)
Table 75: MEA Radiopharmaceutical Therapies Market Forecast by Radioisotope Type, 2026-2036 (US$ Million, AGR%, CAGR%)
Table 76: MEA Radiopharmaceutical Therapies Market Forecast by Therapy Type, 2026-2036 (US$ Million, AGR%, CAGR%)
Table 77: MEA Radiopharmaceutical Therapies Market Forecast by Indication, 2026-2036 (US$ Million, AGR%, CAGR%)
Table 78: MEA Radiopharmaceutical Therapies Market Forecast by End-users, 2026-2036 (US$ Million, AGR%, CAGR%)
Table 79: GCC Radiopharmaceutical Therapies Market Forecast, 2026-2036 (US$ Million, AGR%, CAGR%)
Table 80: South Africa Radiopharmaceutical Therapies Market Forecast, 2026-2036 (US$ Million, AGR%, CAGR%)
Table 81: Egypt Radiopharmaceutical Therapies Market Forecast, 2026-2036 (US$ Million, AGR%, CAGR%)
Table 82: Rest of MEA Radiopharmaceutical Therapies Market Forecast, 2026-2036 (US$ Million, AGR%, CAGR%)
Table 83: Strategic Outlook Summary Table
Table 84: Novartis AG: Key Details
Table 85: Novartis AG: Product Benchmarking
Table 86: Novartis AG: Strategic Outlook
Table 87: Lantheus Holdings, Inc.: Key Details
Table 88: Lantheus Holdings, Inc.: Product Benchmarking
Table 89: Lantheus Holdings, Inc.: Strategic Outlook
Table 90: Bayer AG: Key Details
Table 91: Bayer AG: Product Benchmarking
Table 92: Bayer AG: Strategic Outlook
Table 93: Eli Lilly and Company: Key Details
Table 94: Eli Lilly and Company: Product Benchmarking
Table 95: Eli Lilly and Company: Strategic Outlook
Table 96: Telix Pharmaceuticals Limited: Key Details
Table 97: Telix Pharmaceuticals Limited: Product Benchmarking
Table 98: Telix Pharmaceuticals Limited: Strategic Outlook
Table 99: GE HealthCare Technologies Inc.: Key Details
Table 100: GE HealthCare Technologies Inc.: Product Benchmarking
Table 101: GE HealthCare Technologies Inc.: Strategic Outlook
Table 102: Siemens Healthineers AG: Key Details
Table 103: Siemens Healthineers AG: Product Benchmarking
Table 104: Siemens Healthineers AG: Strategic Outlook
Table 105: Cardinal Health, Inc.: Key Details
Table 106: Cardinal Health, Inc.: Product Benchmarking
Table 107: Cardinal Health, Inc.: Strategic Outlook
Table 108: Clarity Pharmaceuticals Ltd: Key Details
Table 109: Clarity Pharmaceuticals Ltd: Product Benchmarking
Table 110: Clarity Pharmaceuticals Ltd: Strategic Outlook
Table 111: Actinium Pharmaceuticals, Inc.: Key Details
Table 112: Actinium Pharmaceuticals, Inc.: Product Benchmarking
Table 113: Actinium Pharmaceuticals, Inc.: Strategic Outlook
Table 114: Perspective Therapeutics, Inc.: Key Details
Table 115: Perspective Therapeutics, Inc.: Product Benchmarking
Table 116: Perspective Therapeutics, Inc.: Strategic Outlook
Table 117: Curium Holding France S.A.S: Key Details
List of Figures
Figure 1 Radiopharmaceutical Therapies Market Segmentation
Figure 2 Radiopharmaceutical Therapies Market by Radioisotope Type: Market Attractiveness Index
Figure 3 Radiopharmaceutical Therapies Market by Therapy Type: Market Attractiveness Index
Figure 4 Radiopharmaceutical Therapies Market by Indication: Market Attractiveness Index
Figure 5 Radiopharmaceutical Therapies Market by End-user: Market Attractiveness Index
Figure 6 Radiopharmaceutical Therapies Market Attractiveness Index by Region
Figure 7 Radiopharmaceutical Therapies Market: Market Dynamics
Figure 8 Radiopharmaceutical Therapies Market: Impact Analysis
Figure 9 Radiopharmaceutical Therapies Market by Region, 2026-2036 (US$ Million, AGR %), Tariff Impact: V-Shaped Recovery Scenario
Figure 10 Radiopharmaceutical Therapies Market by Region, 2026-2036 (US$ Million, AGR %), Tariff Impact: U-Shaped Recovery Scenario
Figure 11 Radiopharmaceutical Therapies Market by Region, 2026-2036 (US$ Million, AGR %), Tariff Impact: L-Shaped Recovery Scenario
Figure 12 Radiopharmaceutical Therapies Market: Porter’s Five Forces Analysis
Figure 13 Radiopharmaceutical Therapies Market: PEST Analysis
Figure 14 Radiopharmaceutical Therapies Market by Radioisotope Type: Market Attractiveness Index
Figure 15 Radiopharmaceutical Therapies Market Forecast by Radioisotope Type, 2026-2036 (US$ Million, AGR %)
Figure 16 Radiopharmaceutical Therapies Market Share Forecast by Radioisotope Type, 2026, 2030, 2036 (%)
Figure 17 Lutetium-177 Segment Market Forecast by Region, 2026-2036 (US$ Million, AGR %)
Figure 18 Lutetium-177 Segment Market Share Forecast by Region, 2026 & 2036 (%)
Figure 19 Actinium-225 Segment Market Forecast by Region, 2026-2036 (US$ Million, AGR %)
Figure 20 Actinium-225 Segment Market Share Forecast by Region, 2026 & 2036 (%)
Figure 21 Yttrium-90 Segment Market Forecast by Region, 2026-2036 (US$ Million, AGR %)
Figure 22 Yttrium-90 Segment Market Share Forecast by Region, 2026 & 2036 (%)
Figure 23 Iodine-131 Segment Market Forecast by Region, 2026-2036 (US$ Million, AGR %)
Figure 24 Iodine-131 Segment Market Share Forecast by Region, 2026 & 2036 (%)
Figure 25 Radium-223 Segment Market Forecast by Region, 2026-2036 (US$ Million, AGR %)
Figure 26 Radium-223 Segment Market Share Forecast by Region, 2026 & 2036 (%)
Figure 27 Others Segment Market Forecast by Region, 2026-2036 (US$ Million, AGR %)
Figure 28 Others Segment Market Share Forecast by Region, 2026 & 2036 (%)
Figure 29 Radiopharmaceutical Therapies Market by Therapy Type: Market Attractiveness Index
Figure 30 Radiopharmaceutical Therapies Market Forecast by Therapy Type, 2026-2036 (US$ Million, AGR %)
Figure 31 Radiopharmaceutical Therapies Market Share Forecast by Therapy Type, 2026, 2030, 2036 (%)
Figure 32 Non-PRRT Radioligand Therapy (RLT) Segment Market Forecast by Region, 2026-2036 (US$ Million, AGR %)
Figure 33 Non-PRRT Radioligand Therapy (RLT) Segment Market Share Forecast by Region, 2026 & 2036
Figure 34 Peptide Receptor Radionuclide Therapy (PRRT) Segment Market Forecast by Region, 2026-2036 (US$ Million, AGR %)
Figure 35 Peptide Receptor Radionuclide Therapy (PRRT) Segment Market Share Forecast by Region, 2026 & 2036 (%)
Figure 36 Targeted Alpha Therapy (TAT) Segment Market Forecast by Region, 2026-2036 (US$ Million, AGR %)
Figure 37 Targeted Alpha Therapy (TAT) Segment Market Share Forecast by Region, 2026 & 2036 (%)
Figure 38 Radioimmunotherapy Segment Market Forecast by Region, 2026-2036 (US$ Million, AGR %)
Figure 39 Radioimmunotherapy Segment Market Share Forecast by Region, 2026 & 2036 (%)
Figure 40 Brachytherapy & Others Segment Market Forecast by Region, 2026-2036 (US$ Million, AGR %)
Figure 41 Brachytherapy & Others Segment Market Share Forecast by Region, 2026 & 2036 (%)
Figure 42 Radiopharmaceutical Therapies Market by Indication: Market Attractiveness Index
Figure 43 Radiopharmaceutical Therapies Market Forecast by Indication, 2026-2036 (US$ Million, AGR %)
Figure 44 Radiopharmaceutical Therapies Market Share Forecast by Indication, 2026, 2030, 2036 (%)
Figure 45 Prostate Cancer Segment Market Forecast by Region, 2026-2036 (US$ Million, AGR %)
Figure 46 Prostate Cancer Segment Market Share Forecast by Region, 2026 & 2036 (%)
Figure 47 Neuroendocrine Tumors (NETs) Segment Market Forecast by Region, 2026-2036 (US$ Million, AGR %)
Figure 48 Neuroendocrine Tumors (NETs) Segment Market Share Forecast by Region, 2026 & 2036 (%)
Figure 49 Thyroid Cancer Segment Market Forecast by Region, 2026-2036 (US$ Million, AGR %)
Figure 50 Thyroid Cancer Segment Market Share Forecast by Region, 2026 & 2036 (%)
Figure 51 Lymphoma Segment Market Forecast by Region, 2026-2036 (US$ Million, AGR %)
Figure 52 Lymphoma Segment Market Share Forecast by Region, 2026 & 2036 (%)
Figure 53 Bone Metastases Segment Market Forecast by Region, 2026-2036 (US$ Million, AGR %)
Figure 54 Bone Metastases Segment Market Share Forecast by Region, 2026 & 2036 (%)
Figure 55 Others Segment Market Forecast by Region, 2026-2036 (US$ Million, AGR %)
Figure 56 Others Segment Market Share Forecast by Region, 2026 & 2036 (%)
Figure 57 Radiopharmaceutical Therapies Market by End-user: Market Attractiveness Index
Figure 58 Radiopharmaceutical Therapies Market Forecast by End-user 2026-2036 (US$ Million, AGR %)
Figure 59 Radiopharmaceutical Therapies Market Share Forecast by End-user, 2026, 2030, 2036 (%)
Figure 60 Hospitals Oncology Segment Market Forecast by Region, 2026-2036 (US$ Million, AGR %)
Figure 61 Hospitals Segment Market Share Forecast by Region, 2026 & 2036 (%)
Figure 62 Specialty & Comprehensive Cancer Centers Segment Market Forecast by Region, 2026-2036 (US$ Million, AGR%, CAGR%)
Figure 63 Specialty & Comprehensive Cancer Centers Segment Market Forecast by Region, 2026-2036 (US$ Million, AGR %)
Figure 64 Specialty & Comprehensive Cancer Centers Segment Market Share Forecast by Region, 2026 & 2036 (%)
Figure 65 Diagnostic & Nuclear Medicine Imaging Centers Segment Market Forecast by Region, 2026-2036 (US$ Million, AGR %)
Figure 66 Diagnostic & Nuclear Medicine Imaging Centers Segment Market Share Forecast by Region, 2026 & 2036 (%)
Figure 67 Other Segment Market Forecast by Region, 2026-2036 (US$ Million, AGR %)
Figure 68 Other Segment Market Share Forecast by Region, 2026 & 2036 (%)
Figure 69 Radiopharmaceutical Therapies Market Forecast by Region 2026 and 2036 (Revenue, CAGR %)
Figure 70 Radiopharmaceutical Therapies Market Share Forecast by Region 2026, 2030, 2036 (%)
Figure 71 Radiopharmaceutical Therapies Market by Region, 2026-2036 (US$ Million, AGR %)
Figure 72 North America Radiopharmaceutical Therapies Market Attractiveness Index
Figure 73 North America Radiopharmaceutical Therapies Market by Region, 2026, 2031 & 2036 (US$ Million)
Figure 74 North America Radiopharmaceutical Therapies Market Forecast by Country, 2026-2036 (US$ Million, AGR %)
Figure 75 North America Radiopharmaceutical Therapies Market Share Forecast by Country, 2026 & 2036 (%)
Figure 76 North America Radiopharmaceutical Therapies Market Forecast by Radioisotope Type, 2026-2036 (US$ Million, AGR %)
Figure 77 North America Radiopharmaceutical Therapies Market Share Forecast by Country, 2026 & 2036 (%)
Figure 78 North America Radiopharmaceutical Therapies Market Forecast by Therapy Type, 2026-2036 (US$ Million, AGR%, CAGR%)
Figure 79 North America Radiopharmaceutical Therapies Market Forecast by Therapy Type, 2026-2036 (US$ Million, AGR %)
Figure 80 North America Radiopharmaceutical Therapies Market Share Forecast by Therapy Type, 2026 & 2036 (%)
Figure 81 North America Radiopharmaceutical Therapies Market Forecast by Indication, 2026-2036 (US$ Million, AGR %)
Figure 82 North America Radiopharmaceutical Therapies Market Share Forecast by Indication, 2026 & 2036 (%)
Figure 83 North America Radiopharmaceutical Therapies Market Forecast by End-users, 2026-2036 (US$ Million, AGR %)
Figure 84 North America Radiopharmaceutical Therapies Market Share Forecast by End-users, 2026 & 2036 (%)
Figure 85 U.S. Radiopharmaceutical Therapies Market Forecast, 2026-2036 (US$ Million, AGR %)
Figure 86 Canada Radiopharmaceutical Therapies Market Forecast, 2026-2036 (US$ Million, AGR%, CAGR %)
Figure 87 Canada Radiopharmaceutical Therapies Market Forecast, 2026-2036 (US$ Million, AGR %)
Figure 88 Europe Radiopharmaceutical Therapies Market Attractiveness Index
Figure 89 Europe Radiopharmaceutical Therapies Market by Region, 2026, 2031 & 2036 (US$ Million)
Figure 90 Europe Radiopharmaceutical Therapies Market Forecast by Country, 2026-2036 (US$ Million, AGR %)
Figure 91 Europe Radiopharmaceutical Therapies Market Share Forecast by Country, 2026 & 2036 (%)
Figure 92 Europe Radiopharmaceutical Therapies Market Forecast by Radioisotope Type, 2026-2036 (US$ Million, AGR %)
Figure 93 Europe Radiopharmaceutical Therapies Market Share Forecast by Country, 2026 & 2036 (%)
Figure 94 Europe Radiopharmaceutical Therapies Market Forecast by Therapy Type, 2026-2036 (US$ Million, AGR %)
Figure 95 Europe Radiopharmaceutical Therapies Market Share Forecast by Therapy Type, 2026 & 2036 (%)
Figure 96 Europe Radiopharmaceutical Therapies Market Forecast by Indication, 2026-2036 (US$ Million, AGR %)
Figure 97 Europe Radiopharmaceutical Therapies Market Share Forecast by Indication, 2026 & 2036 (%)
Figure 98 Europe Radiopharmaceutical Therapies Market Forecast by End-users, 2026-2036 (US$ Million, AGR %)
Figure 99 Europe Radiopharmaceutical Therapies Market Share Forecast by End-users, 2026 & 2036 (%)
Figure 100 Germany Radiopharmaceutical Therapies Market Forecast, 2026-2036 (US$ Million, AGR %)
Figure 101 France Radiopharmaceutical Therapies Market Forecast, 2026-2036 (US$ Million, AGR %)
Figure 102 UK Radiopharmaceutical Therapies Market Forecast, 2026-2036 (US$ Million, AGR %)
Figure 103 Italy Radiopharmaceutical Therapies Market Forecast, 2026-2036 (US$ Million, AGR %)
Figure 104 Spain Radiopharmaceutical Therapies Market Forecast, 2026-2036 (US$ Million, AGR %)
Figure 105 Switzerland Radiopharmaceutical Therapies Market Forecast, 2026-2036 (US$ Million, AGR %)
Figure 106 Poland Radiopharmaceutical Therapies Market Forecast, 2026-2036 (US$ Million, AGR %)
Figure 107 Belgium Radiopharmaceutical Therapies Market Forecast, 2026-2036 (US$ Million, AGR %)
Figure 108 Netherlands Radiopharmaceutical Therapies Market Forecast, 2026-2036 (US$ Million, AGR %)
Figure 109 Rest of Europe Radiopharmaceutical Therapies Market Forecast, 2026-2036 (US$ Million, AGR %)
Figure 110 Asia Pacific Radiopharmaceutical Therapies Market Attractiveness Index
Figure 111 Asia Pacific Radiopharmaceutical Therapies Market by Region, 2026, 2031 & 2036 (US$ Million)
Figure 112 Asia Pacific Radiopharmaceutical Therapies Market Forecast by Country, 2026-2036 (US$ Million, AGR %)
Figure 113 Asia Pacific Radiopharmaceutical Therapies Market Share Forecast by Country, 2026 & 2036 (%)
Figure 114 Asia Pacific Radiopharmaceutical Therapies Market Forecast by Radioisotope Type, 2026-2036 (US$ Million, AGR %)
Figure 115 Asia Pacific Radiopharmaceutical Therapies Market Share Forecast by Country, 2026 & 2036 (%)
Figure 116 Asia Pacific Radiopharmaceutical Therapies Market Forecast by Therapy Type, 2026-2036 (US$ Million, AGR %)
Figure 117 Asia Pacific Radiopharmaceutical Therapies Market Share Forecast by Therapy Type, 2026 & 2036 (%)
Figure 118 Asia Pacific Radiopharmaceutical Therapies Market Forecast by Indication, 2026-2036 (US$ Million, AGR %)
Figure 119 Asia Pacific Radiopharmaceutical Therapies Market Share Forecast by Indication, 2026 & 2036 (%)
Figure 120 Asia Pacific Radiopharmaceutical Therapies Market Forecast by End-users, 2026-2036 (US$ Million, AGR %)
Figure 121 Asia Pacific Radiopharmaceutical Therapies Market Share Forecast by End-users, 2026 & 2036 (%)
Figure 122 China Radiopharmaceutical Therapies Market Forecast, 2026-2036 (US$ Million, AGR %)
Figure 123 Japan Radiopharmaceutical Therapies Market Forecast, 2026-2036 (US$ Million, AGR %)
Figure 124 India Radiopharmaceutical Therapies Market Forecast, 2026-2036 (US$ Million, AGR %)
Figure 125 South Korea Radiopharmaceutical Therapies Market Forecast, 2026-2036 (US$ Million, AGR %)
Figure 126 Australia Radiopharmaceutical Therapies Market Forecast, 2026-2036 (US$ Million, AGR %)
Figure 127 Rest of Asia Pacific Radiopharmaceutical Therapies Market Forecast, 2026-2036 (US$ Million, AGR %)
Figure 128 Latin America Radiopharmaceutical Therapies Market Attractiveness Index
Figure 129 Latin America Radiopharmaceutical Therapies Market by Region, 2026, 2031 & 2036 (US$ Million)
Figure 130 Latin America Radiopharmaceutical Therapies Market Forecast by Country, 2026-2036 (US$ Million, AGR %)
Figure 131 Latin America Radiopharmaceutical Therapies Market Share Forecast by Country, 2026 & 2036 (%)
Figure 132 Latin America Radiopharmaceutical Therapies Market Forecast by Radioisotope Type, 2026-2036 (US$ Million, AGR %)
Figure 133 Latin America Radiopharmaceutical Therapies Market Share Forecast by Country, 2026 & 2036 (%)
Figure 134 Latin America Radiopharmaceutical Therapies Market Forecast by Therapy Type, 2026-2036 (US$ Million, AGR %)
Figure 135 Latin America Radiopharmaceutical Therapies Market Share Forecast by Therapy Type, 2026 & 2036 (%)
Figure 136 Latin America Radiopharmaceutical Therapies Market Forecast by Indication, 2026-2036 (US$ Million, AGR %)
Figure 137 Latin America Radiopharmaceutical Therapies Market Share Forecast by Indication, 2026 & 2036 (%)
Figure 138 Latin America Radiopharmaceutical Therapies Market Forecast by End-users, 2026-2036 (US$ Million, AGR %)
Figure 139 Latin America Radiopharmaceutical Therapies Market Share Forecast by End-users, 2026 & 2036 (%)
Figure 140 Brazil Radiopharmaceutical Therapies Market Forecast, 2026-2036 (US$ Million, AGR %)
Figure 141 Mexico Radiopharmaceutical Therapies Market Forecast, 2026-2036 (US$ Million, AGR %)
Figure 142 Rest of Latin America Radiopharmaceutical Therapies Market Forecast, 2026-2036 (US$ Million, AGR %)
Figure 143 MEA Radiopharmaceutical Therapies Market Attractiveness Index
Figure 144 MEA Radiopharmaceutical Therapies Market by Region, 2026, 2031 & 2036 (US$ Million)
Figure 145 MEA Radiopharmaceutical Therapies Market Forecast by Country, 2026-2036 (US$ Million, AGR %)
Figure 146 MEA Radiopharmaceutical Therapies Market Share Forecast by Country, 2026 & 2036 (%)
Figure 147 MEA Radiopharmaceutical Therapies Market Forecast by Radioisotope Type, 2026-2036 (US$ Million, AGR %)
Figure 148 MEA Radiopharmaceutical Therapies Market Share Forecast by Country, 2026 & 2036 (%)
Figure 149 MEA Radiopharmaceutical Therapies Market Forecast by Therapy Type, 2026-2036 (US$ Million, AGR %)
Figure 150 MEA Radiopharmaceutical Therapies Market Share Forecast by Therapy Type, 2026 & 2036 (%)
Figure 151 MEA Radiopharmaceutical Therapies Market Forecast by Indication, 2026-2036 (US$ Million, AGR %)
Figure 152 MEA Radiopharmaceutical Therapies Market Share Forecast by Indication, 2026 & 2036 (%)
Figure 153 MEA Radiopharmaceutical Therapies Market Forecast by End-users, 2026-2036 (US$ Million, AGR %)
Figure 154 MEA Radiopharmaceutical Therapies Market Share Forecast by End-users, 2026 & 2036 (%)
Figure 155 GCC Radiopharmaceutical Therapies Market Forecast, 2026-2036 (US$ Million, AGR %)
Figure 156 South Africa Radiopharmaceutical Therapies Market Forecast, 2026-2036 (US$ Million, AGR %)
Figure 157 Egypt Radiopharmaceutical Therapies Market Forecast, 2026-2036 (US$ Million, AGR %)
Figure 158 Rest of MEA Radiopharmaceutical Therapies Market Forecast, 2026-2036 (US$ Million, AGR %)
Figure 159 Novartis AG: Net Revenue, 2021-2025 (US$ Million, AGR%)
Figure 160 Novartis AG: R&D, 2021-2025 (US$ Million, AGR%)
Figure 161 Novartis AG: Regional Market Shares, 2025
Figure 162 Novartis AG: Business Segment Market Shares, 2025
Figure 163 Lantheus Holdings, Inc.: Net Revenue, 2021-2025 (US$ Million, AGR%)
Figure 164 Lantheus Holdings, Inc.: R&D, 2021-2025 (US$ Million, AGR%)
Figure 165 Lantheus Holdings, Inc.: Regional Market Shares, 2025
Figure 166 Lantheus Holdings, Inc.: Business Segment Market Shares, 2025
Figure 167 Bayer AG: Net Revenue, 2021-2025 (US$ Million, AGR%)
Figure 168 Bayer AG: R&D, 2021-2025 (US$ Million, AGR%)
Figure 169 Bayer AG: Regional Market Shares, 2025
Figure 170 Bayer AG: Business Segment Market Shares, 2025
Figure 171 Eli Lilly and Company: Net Revenue, 2021-2025 (US$ Million, AGR%)
Figure 172 Eli Lilly and Company: R&D, 2021-2025 (US$ Million, AGR%)
Figure 173 Eli Lilly and Company: Regional Market Shares, 2025
Figure 174 Eli Lilly and Company: Business Segment Market Shares, 2025
Figure 175 Telix Pharmaceuticals Limited: Net Revenue, 2021-2025 (US$ Million, AGR%)
Figure 176 Telix Pharmaceuticals Limited: R&D, 2021-2025 (US$ Million, AGR%)
Figure 177 Telix Pharmaceuticals Limited: Regional Market Shares, 2025
Figure 178 Telix Pharmaceuticals Limited: Business Segment Market Shares, 2025
Figure 179 GE HealthCare Technologies Inc.: Net Revenue, 2021-2025 (US$ Million, AGR%)
Figure 180 GE HealthCare Technologies Inc.: Regional Market Shares, 2025
Figure 181 GE HealthCare Technologies Inc.: Business Segment Market Shares, 2025
Figure 182 Siemens Healthineers AG: Net Revenue, 2021-2025 (US$ Million, AGR%)
Figure 183 Siemens Healthineers AG: Regional Market Shares, 2025
Figure 184 Siemens Healthineers AG: Business Segment Market Shares, 2025
Figure 185 Cardinal Health, Inc.: Net Revenue, 2021-2025 (US$ Million, AGR%)
Figure 186 Cardinal Health, Inc.: Regional Market Shares, 2025
Figure 187 Cardinal Health, Inc.: Business Segment Market Shares, 2025
Figure 188 Clarity Pharmaceuticals Ltd.: Net Revenue, 2021-2025 (US$ Million, AGR%)
Figure 189 Clarity Pharmaceuticals Ltd.: R&D, 2021-2025 (US$ Million, AGR%)
Figure 190 Actinium Pharmaceuticals, Inc.: Net Revenue, 2021-2025 (US$ Million, AGR%)
Figure 191 Actinium Pharmaceuticals, Inc.: Regional Market Shares, 2025
Figure 192 Perspective Therapeutics, Inc.: Net Revenue, 2021-2025 (US$ Million, AGR%)
Figure 193 Perspective Therapeutics, Inc.: R&D, 2021-2025 (US$ Million, AGR%)
Figure 194 Perspective Therapeutics, Inc.: Business Segment Market Shares, 2025
Figure 195 Eckert & Ziegler: Net Revenue, 2021-2025 (US$ Million, AGR%)
Figure 196 Eckert & Ziegler: R&D, 2021-2025 (US$ Million, AGR%)
Figure 197 Eckert & Ziegler: Business Segment Market Shares, 2025
Figure 198 Bristol-Myers Squibb Company: Net Revenue, 2021-2025 (US$ Million, AGR%)
Figure 199 Bristol-Myers Squibb Company: R&D, 2021-2025 (US$ Million, AGR%)
Figure 200 Bristol-Myers Squibb Company: Business Segment Market Shares, 2025
ページTOPに戻る
本レポートと同じKEY WORD()の最新刊レポート
- 本レポートと同じKEY WORDの最新刊レポートはありません。
よくあるご質問
Visiongain社はどのような調査会社ですか?
英国の調査会社ヴィジョンゲイン社(Visiongain)は、通信とエネルギーのほか、自動車や化学・医薬品、金属など、広範な市場を対象に調査を行っています。自動車市場については、市場全般に関する調査のほ... もっと見る
調査レポートの納品までの日数はどの程度ですか?
在庫のあるものは速納となりますが、平均的には 3-4日と見て下さい。
但し、一部の調査レポートでは、発注を受けた段階で内容更新をして納品をする場合もあります。
発注をする前のお問合せをお願いします。
注文の手続きはどのようになっていますか?
1)お客様からの御問い合わせをいただきます。
2)見積書やサンプルの提示をいたします。
3)お客様指定、もしくは弊社の発注書をメール添付にて発送してください。
4)データリソース社からレポート発行元の調査会社へ納品手配します。
5) 調査会社からお客様へ納品されます。最近は、pdfにてのメール納品が大半です。
お支払方法の方法はどのようになっていますか?
納品と同時にデータリソース社よりお客様へ請求書(必要に応じて納品書も)を発送いたします。
お客様よりデータリソース社へ(通常は円払い)の御振り込みをお願いします。
請求書は、納品日の日付で発行しますので、翌月最終営業日までの当社指定口座への振込みをお願いします。振込み手数料は御社負担にてお願いします。
お客様の御支払い条件が60日以上の場合は御相談ください。
尚、初めてのお取引先や個人の場合、前払いをお願いすることもあります。ご了承のほど、お願いします。
データリソース社はどのような会社ですか?
当社は、世界各国の主要調査会社・レポート出版社と提携し、世界各国の市場調査レポートや技術動向レポートなどを日本国内の企業・公官庁及び教育研究機関に提供しております。
世界各国の「市場・技術・法規制などの」実情を調査・収集される時には、データリソース社にご相談ください。
お客様の御要望にあったデータや情報を抽出する為のレポート紹介や調査のアドバイスも致します。
|
|