モバイルとデジタルヘルス技術市場レポート:2024-2034
Mobile and Digital Health Technologies Market Report 2024-2034
レポート詳細
モバイルとデジタルヘルス技術市場レポート 2024-2034年 :本レポートは、業界とその根底にあるダイナミクスをより良く理解したいと望むならば、新たな収益ポケットを目指す大手企業に... もっと見る
※上記価格は部署ライセンス(Departmental licence)価格です。
その他の価格についてはデータリソースまでお問合せください。
日本語のページは自動翻訳を利用し作成しています。
実際のレポートは英文のみでご納品いたします。

|

|
サマリー
レポート詳細
モバイルとデジタルヘルス技術市場レポート 2024-2034年:本レポートは、業界とその根底にあるダイナミクスをより良く理解したいと望むならば、新たな収益ポケットを目指す大手企業にとって貴重なものとなるでしょう。異業種への進出や新規地域での既存事業の拡大を目指す企業にも有用です。
世界的なスマートフォンの普及が業界の成長を後押し
スマートフォンのユビキタス化に伴い、医療システムへの統合は、医療情報へのアクセスを改善し、患者と医療提供者間のコミュニケーションを促進し、個人が自分の健康とウェルネスを管理できるようにするための無数の機会を開いている。スマートフォンの普及がヘルスケアに与える主な影響のひとつは、モバイルヘルス(mHealth)アプリケーションの普及である。これらのアプリケーションは、フィットネストラッカーや症状チェッカーから、服薬リマインダーや慢性疾患管理ツールまで多岐にわたる。これらのアプリケーションは、センサー、GPS、接続性といったスマートフォンの機能を活用し、健康関連データをリアルタイムで収集、分析、発信する。ユーザーにとってこれらのアプリは利便性を提供し、自分の健康指標をモニターし、フィットネス目標に向けた進捗を追跡し、指先でパーソナライズされた健康勧告にアクセスすることを可能にする。スマートフォンは、遠隔医療や遠隔患者モニタリング・ソリューションの進歩に極めて重要な役割を果たしている。ビデオ通話、メッセージング・アプリケーション、セキュア・プラットフォームを活用することで、個人は遠くからでも便利に医療専門家に相談できるようになり、面会予約の必要性がなくなった。これは、移動が不自由な人や地方に住んでいる人、従来の医療サービスにアクセスする際に障害に遭遇している人には特に有利である。さらに、スマートフォンの普及は、医療提供者や医療機関に、患者との関わりやコミュニケーションを強化する機会を与えている。
モバイル対応のウェブサイト、患者ポータル、安全なメッセージング・プラットフォームは、患者と医療提供者のシームレスな対話を可能にし、予約スケジュール、処方箋の補充、医療記録へのアクセスを容易にする。2024年現在、約48億8,000万人がスマートフォンを所有していると推定され、過去1年間(2023年から2024年まで)で新たに6億3,500万人のスマートフォンユーザーが増加したことになる。統計によると、2019年のユーザー数は22.7億人、2020年、26.7億人、2021年、30.1億人、2022年、36.2億人、2023年、42.5億人である。
医療費増大の課題に対処するための有望な道として浮上するデジタルヘルス技術
医療費の高騰は世界的に大きな問題となっており、医療の質を維持・向上させながら医療費を削減する革新的なソリューションが求められている。デジタルヘルス技術は、医療費増大という課題に対処するための有望な手段として浮上してきた。これらのテクノロジーは、デジタル・プラットフォーム、データ分析、コミュニケーション・ツールを活用して、プロセスを合理化し、効率を高め、ヘルスケアのエコシステム全体でリソースの利用を最適化する。
デジタルヘルス技術がコスト抑制に貢献する主な方法の一つは、医療提供プロセスの最適化である。予約スケジューリング、請求書作成、カルテ管理などの管理業務をデジタル化することで、医療提供者は紙ベースのシステムや手作業のワークフローに関連するオーバーヘッド・コストを削減することができる。医療管理へのこの積極的なアプローチは、高価な合併症を予防し、病院での再入院を減らし、健康問題が発生したときにタイムリーな介入を可能にし、最終的に医療費全体を削減するのに役立つ。さらに、遠隔医療プラットフォームは、患者と医療提供者の間のバーチャルな協議を促進し、多くの場合、物理的な診察の必要性をなくします。
これにより、交通費や予約時間までの移動時間が削減されるだけでなく、医療提供者は1日に多くの患者を診ることができるため、時間を最適化し、診療効率を高めることができる。さらに、遠隔医療は、十分な医療が行き届いていない地域や地方の患者の専門医療へのアクセスを向上させ、医療提供における格差を縮小し、治療の遅れや不適切な治療に伴う費用のかかる合併症を予防する可能性がある。
市場調査レポートを購入する前にすべき質問とは?
-
モバイルとデジタルヘルス技術市場はどのように進化しているのか?
-
モバイルとデジタルヘルス技術市場の推進要因と抑制要因は何か?
-
モバイルとデジタルヘルス技術の各サブマーケットセグメントは予測期間中にどのように成長し、これらのサブマーケットが2034年にどれくらいの収益を占めるのか?
-
2024年から2034年にかけて、モバイルとデジタルヘルス技術の各サブマーケットの市場シェアはどのように推移するのか?
-
2024年から2034年までの市場全体の主な牽引役は何か?
-
モバイルとデジタルヘルス技術の主要市場はマクロ経済ダイナミクスに概ね追随するのか、それとも個々の国市場が他を凌駕するのか?
-
2034年までに各国市場のシェアはどのように変化し、2034年に市場をリードするのはどの地域か?
-
主要プレーヤーは誰で、予測期間中の見通しは?
-
これら主要企業のモバイルとデジタルヘルス技術プロジェクトとは?
-
2024年から2034年の間に、業界はどのように進化するのか?現在および今後10年間に実施されるモバイルとデジタルヘルス技術のプロジェクトが意味するものは何か?
-
モバイルとデジタルヘルス技術市場をさらに拡大するために、製品化の必要性は高まっていますか?
-
モバイルとデジタルヘルス技術市場はどこに向かい、どのようにすれば市場の最前線に立てるのか?
-
新製品やサービスラインに対する最適な投資オプションは何か?
-
企業を新たな成長軌道に乗せ、C-suiteに移行させるための重要な展望とは?
モバイルとデジタルヘルス技術市場が現在、そして今後10年間でどのような影響を受けるかを知る必要がある:
-
429ページに及ぶレポートには、179の表と240の図表が掲載されている。
-
本レポートでは、業界における主要な有利分野を取り上げているため、今すぐターゲットを絞ることができる。
-
世界、地域、国の売上高と成長に関する詳細な分析が含まれている。
-
競合他社が成功した主なトレンド、変化、収益予測をハイライトします。
本レポートは、モバイルとデジタルヘルス技術市場が今後10年間にどのように発展していくのか、またCOVID-19の景気後退と好転の変動に合わせてどのように発展していくのかをお伝えします。この市場は、過去10年間のどの時点よりも今が重要である。
2034年までの予測やその他の分析から、商業的な展望が明らかになる
-
2034年までの収益予測に加え、最近の実績、成長率、市場シェアも提供している。
-
ビジネスの展望や展開など、独自の分析が掲載されている。
-
定性的分析(市場ダイナミクス、促進要因、機会、阻害要因、課題を含む)、コスト構造、モバイルおよびデジタルヘルス技術の価格上昇の影響、最新動向をご覧いただけます。
本レポートには、COVID-19が業界と貴社にどのような影響を与えるかについてのデータ分析と貴重な洞察が含まれている。本レポートでは、COVID-19の4つの回収パターンとその影響、すなわち「V」、「L」、「W」、「U」について論じている。
レポート対象セグメント
テクノロジー
-
遠隔医療
-遠隔介護(アクティビティ・モニタリング、遠隔服薬管理)
-遠隔医療(LTCモニタリング、ビデオ相談)
-
mヘルス
-ウェアラブル(BPモニター、グルコースメーター、パルスオキシメーター、睡眠時無呼吸モニター、神経モニター、その他)
-アプリ
-
医療アプリ
-
フィットネスアプリ
-
デジタル・ヘルス・システム
-電子カルテ
-電子処方システム
-
ヘルス・アナリティクス
コンポーネント
申し込み
-
心臓病学
-
糖尿病
-
肥満
-
神経学
-
睡眠時無呼吸症候群
-
その他
エンドユーザー
世界市場全体と各分野の売上予測に加え、4つの地域と27の主要国市場の売上予測も掲載しています:
北米
欧州
-
ドイツ
-
英国
-
フランス
-
スペイン
-
イタリア
-
ロシア
-
ポーランド
-
ベルギー
-
その他の欧州地域
アジア太平洋
-
中国
-
日本
-
インド
-
オーストラリア
-
韓国
-
シンガポール
-
台湾
-
その他のアジア太平洋地域
ラテンアメリカ
-
ブラジル
-
メキシコ
-
アルゼンチン
-
コロンビア
-
その他のラテンアメリカ地域
MEA
2024年から2034年までのモバイル・デジタルヘルス技術市場における主要企業のプロファイルも掲載しています。
報告書に掲載されている主要企業
-
AdvancedMD
-
Allscripts Healthcare Solutions Inc.
-
Apple Inc.
-
Athenahealth, Inc.
-
AT & T
-
BioTelemetry Inc.
-
Oracle (Cerner Corporation)
-
Cisco Systems
-
eClinicalWorks
-
Epic Systems Corporation
-
GE HealthCare
-
IBM
-
iHealth Lab, Inc.
-
Koninklijke Philips N.V.
-
McKesson Corporation
-
Omron Corporation
-
Qualcomm Technologies, Inc.
-
Samsung
-
Siemens Healthineers AG
-
Telefónica IoT & Big Data Tech, S.A.U.
2024年から2034年にかけてのモバイルとデジタルヘルス技術市場の世界全体の売上高は、金額ベースで2024年に2,508億米ドルを突破すると弊社は算出した。2034年まで収益が大きく伸びると予測している。当社の調査では、最も大きな可能性を秘めた組織を特定しています。彼らの能力、進歩、商業的展望を発見し、一歩先を行くお手伝いをします。
2024年から2034年までのモバイルとデジタルヘルス技術市場」レポートはどのようにお役に立ちますか?
要約すると、420ページを超えるこのレポートは、以下の知識を提供する:
-
モバイルとデジタルヘルス技術市場の2024年から2034年までの収益予測 素材、デザイン、タイプ、デリバリー、アプリケーションの各予測を世界と地域レベルで掲載 - 業界の将来性を発見し、投資と収益に最も有利な場所を見つけます。
-
5つの地域と26の主要国市場の2034年までの収益予測 - 北米、欧州、アジア太平洋、ラテンアメリカ、MEAのモバイルとデジタルヘルス技術市場の2024年から2034年までの市場予測をご覧ください。また、米国、カナダ、メキシコ、ブラジル、ドイツ、フランス、英国、イタリア、中国、インド、日本、オーストラリアなどの著名経済圏の市場も予測しています。
-
2024年から2034年までのモバイルとデジタルヘルス技術市場に関わる主要企業20社の企業プロファイルを含む。
独自の予測による定量的・定性的分析をご覧ください。私たちのレポートだけに含まれる情報を入手し、貴重なビジネスインテリジェンスで情報を得ることができます。
他にはない情報
私たちの新しいレポートがあれば、知識に遅れをとったり、チャンスを逃したりする可能性が低くなります。Visiongainの調査レポートが貴社の調査、分析、意思決定にどのように役立つかをご覧ください。Visiongainの調査は、モバイルとデジタルヘルス技術市場、2024年から2034年、市場をリードする企業の商業分析を必要とするすべての人のためのものです。データ、トレンド、予測をご覧いただけます。
ページTOPに戻る
目次
1 レポート概要
1.1 研究の目的
1.2 モバイルとデジタルヘルス技術の紹介
1.3 本レポートの内容
1.4 本レポートを読むべき理由
1.5 本分析レポートが回答する主な質問
1.6 本レポートの対象者
1.7 方法論
1.7.1 市場の定義
1.7.2 市場評価・予測手法
1.7.3 データの検証
1.7.3.1 一次調査
1.7.3.2 セカンダリーリサーチ
1.8 よくある質問(FAQ)
1.9 Visiongainの関連レポート
1.10 Visiongainについて
2 エグゼクティブ・サマリー
3 市場概要
3.1 主要な調査結果
3.2 市場ダイナミクス
3.2.1 市場促進要因
3.2.1.1 スマートフォンの普及拡大
3.2.1.2 スマートウェアラブルデバイスの進歩
3.2.1.3 遠隔医療と遠隔患者モニタリングシステムの出現
3.2.1.4 好ましい政府の取り組みと規制
3.2.1.5 慢性疾患管理のためのコネクテッドデバイスと健康アプリの利用の増加
3.2.1.6 ヘルスケアを中断させないための4G&5Gネットワークの普及拡大
3.2.1.7 患者中心の医療提供への注目の高まり
3.2.1.8 在宅医療サービスの需要増加
3.2.2 市場抑制要因
3.2.2.1 プライバシーとセキュリティへの懸念
3.2.2.2 相互運用性の欠如
3.2.2.3 確立された基準や規制の欠如と不十分な償還金
3.2.2.4 従来の医療従事者からの反対と医師からの助言の制限
3.2.3 市場機会
3.2.3.1 人工知能(AI)と機械学習の進歩
3.2.3.2 慢性疾患の増加
3.2.3.3 ゲノミクスと精密医療の進歩
3.2.3.4 新興市場における拡大機会
3.3 COVID-19インパクト分析
3.4 ポーターのファイブフォース分析
3.4.1 サプライヤーの交渉力
3.4.2 買い手の交渉力
3.4.3 競争上のライバル
3.4.4 代替品の脅威
3.4.5 新規参入企業の脅威
3.5 PEST分析
4 モバイルとデジタルヘルス技術分析:技術別
4.1 主要な調査結果
4.2 技術セグメント 市場魅力度指数
4.3 モバイルとデジタルヘルス技術:技術別市場規模の推定と予測
4.4 遠隔医療
4.4.1 テレヘルスケアによるモバイルとデジタルヘルス技術の市場規模推定と予測
4.4.2 2024~2034年の地域別市場規模(US$ Billion)
4.4.3 遠隔医療
4.4.3.1 テレケア別市場規模、2024〜2034年(US$ Billion)
4.4.3.2 地域別市場規模、2024年~2034年(US$ Billion)
4.4.3.3 地域別市場シェア、2024年・2034年(%)
4.4.3.4 遠隔医療別市場規模、2024〜2034年(US$ Billion)
4.4.3.5 活動モニタリング
4.4.3.6 遠隔服薬管理
4.4.4 遠隔医療
4.4.4.1 地域別市場規模、2024~2034年(US$ Billion)
4.4.4.2 地域別市場シェア、2024年・2034年(%)
4.4.4.3 LTCモニタリング
4.4.4.4 ビデオコンサルテーション
4.5 mHealth
4.5.1 mHealthによるモバイルとデジタルヘルス技術規模の推定と予測
4.5.1.2 ウェアラブル
4.5.1.3 ウェアラブル別市場規模、2024〜2034年(US$ Billion)
4.5.1.4 BPモニター
4.5.1.5 血糖値計
4.5.1.6 パルスオキシメーター
4.5.1.7 睡眠時無呼吸モニター
4.5.1.8 神経モニター
4.5.1.9 その他
4.5.1.10 アプリ
4.5.1.11 タイプ別市場規模、2024〜2034年(US$ Billion)
4.6 デジタルヘルスシステム
4.6.1 モバイルとデジタルヘルス技術のデジタルヘルスシステム別市場規模推定と予測
4.6.1.1 電子カルテ
4.6.1.2 電子処方システム
4.7 ヘルスアナリティクス
4.7.1 2024〜2034年の地域別市場規模(US$ Billion)
4.7.2 地域別市場シェア、2024年・2034年(%)
5 モバイルとデジタルヘルス技術分析:コンポーネント別
5.1 主要な調査結果
5.2 コンポーネント・セグメント 市場魅力度指数
5.3 モバイルとデジタルヘルス技術のコンポーネント別市場規模推定と予測
5.4 ハードウェア
5.4.1 2024〜2034年の地域別市場規模(US$ Billion)
5.4.2 地域別市場シェア、2024年・2034年(%)
5.5 ソフトウェア
5.5.1 2024〜2034年の地域別市場規模(US$ Billion)
5.5.2 地域別市場シェア、2024年・2034年(%)
5.6 サービス
5.6.1 2024〜2034年の地域別市場規模(US$ Billion)
5.6.2 地域別市場シェア、2024年・2034年(%)
6 モバイルとデジタルヘルス技術分析:用途別
6.1 主要調査結果
6.2 用途別セグメント市場魅力度指数
6.3 モバイルとデジタルヘルス技術の用途別市場規模推定と予測
6.4 循環器
6.4.1 2024〜2034年の地域別市場規模(US$ Billion)
6.4.2 地域別市場シェア、2024年・2034年(%)
6.5 糖尿病
6.5.1 2024〜2034年の地域別市場規模(US$ Billion)
6.5.2 地域別市場シェア、2024年・2034年(%)
6.6 肥満症
6.6.1 2024〜2034年の地域別市場規模(US$ Billion)
6.6.2 地域別市場シェア、2024年・2034年(%)
6.7 神経
6.7.1 2024〜2034年の地域別市場規模(US$ Billion)
6.7.2 地域別市場シェア、2024年・2034年(%)
6.8 睡眠時無呼吸症候群
6.8.1 2024〜2034年の地域別市場規模(US$ Billion)
6.8.2 地域別市場シェア、2024年・2034年(%)
6.9 その他
6.9.1 2024〜2034年の地域別市場規模(US$ Billion)
6.9.2 地域別市場シェア、2024年・2034年(%)
7 モバイルとデジタルヘルス技術分析:エンドユーザー別
7.1 主要な調査結果
7.2 エンドユーザーセグメント: 市場魅力度指数
7.3 モバイルとデジタルヘルス技術のエンドユーザー別市場規模推定と予測
7.4 医療プロバイダー
7.4.1 2024〜2034年の地域別市場規模(US$ Billion)
7.4.2 地域別市場シェア、2024年・2034年(%)
7.5 医療費支払者
7.5.1 2024〜2034年の地域別市場規模(US$ Billion)
7.5.2 地域別市場シェア、2024年・2034年(%)
7.6 医療消費者
7.6.1 2024〜2034年の地域別市場規模(US$ Billion)
7.6.2 地域別市場シェア、2024年・2034年(%)
7.7 その他
7.7.1 2024〜2034年の地域別市場規模(US$ Billion)
7.7.2 地域別市場シェア、2024年・2034年(%)
8 モバイルとデジタルヘルス技術分析:地域別
8.1 主要な調査結果
8.2 地域別市場規模の推定と予測
9 北米のモバイルとデジタルヘルス技術の分析
9.1 主要な調査結果
9.2 北米のモバイルとデジタルヘルス技術の魅力度指数
9.3 北米のモバイルとデジタルヘルス技術国別、2024年、2029年、2034年(US$ Billion)
9.4 北米のモバイルとデジタルヘルス技術規模推定と予測:国別
9.5 北米のモバイルとデジタルヘルス技術規模推定と予測:技術別
9.5.1 北米のモバイルとデジタルヘルス技術予測:テレヘルスケア別
9.5.2 北米のモバイルとデジタルヘルス技術予測:mHealth別
9.5.3 北米のモバイルとデジタルヘルス技術予測:デジタルヘルスシステム別
9.6 北米のモバイルとデジタルヘルス技術規模推定と予測:コンポーネント別
9.7 北米のモバイルとデジタルヘルス技術規模推定と予測:用途別
9.8 北米のモバイルとデジタルヘルス技術規模推定と予測:エンドユーザー別
9.9 米国のモバイルとデジタルヘルス技術分析
9.10 カナダのモバイルとデジタルヘルス技術分析
10 欧州のモバイルとデジタルヘルス技術分析
10.1 主要な調査結果
10.2 欧州のモバイルとデジタルヘルス技術の魅力度指数
10.3 欧州のモバイルとデジタルヘルス技術国別、2024年、2029年、2034年(US$ Billion)
10.4 欧州のモバイルとデジタルヘルス技術規模推定と予測:国別
10.5 欧州のモバイルとデジタルヘルス技術市場規模推定と予測:技術別
10.5.1 欧州のモバイルとデジタルヘルス技術予測:テレヘルスケア別
10.5.2 欧州のモバイルとデジタルヘルス技術予測:mHealth別
10.5.3 欧州のモバイルとデジタルヘルス技術予測:デジタルヘルスシステム別
10.6 欧州のモバイルとデジタルヘルス技術規模推定と予測:コンポーネント別
10.7 欧州モバイルとデジタルヘルス技術市場規模推定と予測:用途別
10.8 欧州モバイルとデジタルヘルス技術市場規模推定と予測:エンドユーザー別
10.9 ドイツのモバイルとデジタルヘルス技術分析
10.10 フランスのモバイルとデジタルヘルス技術分析
10.11 イギリスのモバイルとデジタルヘルス技術分析
10.12 イタリアのモバイルとデジタルヘルス技術分析
10.13 スペインのモバイルとデジタルヘルス技術分析
10.14 ロシアのモバイルとデジタルヘルス技術分析
10.15 ポーランドのモバイルとデジタルヘルス技術分析
10.16 ベルギーのモバイルとデジタルヘルス技術分析
10.17 その他の欧州のモバイルとデジタルヘルス技術分析
11 アジア太平洋地域のモバイルとデジタルヘルス技術の分析
11.1 主要な調査結果
11.2 アジア太平洋地域のモバイルとデジタルヘルス技術の魅力度指数
11.3 アジア太平洋地域のモバイルとデジタルヘルス技術国別、2024年、2029年、2034年(US$ Billion)
11.4 アジア太平洋地域のモバイルとデジタルヘルス技術規模推定と予測:国別
11.5 アジア太平洋地域のモバイルとデジタルヘルス技術規模推定と予測:技術別
11.5.1 アジア太平洋地域のモバイルとデジタルヘルス技術市場規模推定と予測:テレヘルスケア別
11.5.2 アジア太平洋地域のモバイルとデジタルヘルス技術市場予測:mHealth別
11.5.3 アジア太平洋地域のモバイルとデジタルヘルス技術市場規模予測:デジタルヘルスシステム別
11.6 アジア太平洋地域のモバイルとデジタルヘルス技術市場規模推定と予測:コンポーネント別
11.7 アジア太平洋地域のモバイルとデジタルヘルス技術市場規模推定と予測:用途別
11.8 アジア太平洋地域のモバイルとデジタルヘルス技術規模推定と予測:エンドユーザー別
11.9 日本のモバイルとデジタルヘルス技術分析
11.10 中国のモバイルとデジタルヘルス技術分析
11.11 インドのモバイルとデジタルヘルス技術分析
11.12 オーストラリアのモバイルとデジタルヘルス技術分析
11.13 韓国のモバイルとデジタルヘルス技術分析
11.14 シンガポールのモバイルとデジタルヘルス技術分析
11.15 台湾のモバイルとデジタルヘルス技術分析
11.16 その他のアジア太平洋地域のモバイルとデジタルヘルス技術分析
12 ラテンアメリカのモバイルとデジタルヘルス技術分析
12.1 主要な調査結果
12.2 ラテンアメリカのモバイルとデジタルヘルス技術の魅力度指数
12.3 ラテンアメリカのモバイルとデジタルヘルス技術国別、2024年、2029年、2034年(US$ Billion)
12.4 ラテンアメリカのモバイルとデジタルヘルス技術市場規模推定と予測:国別
12.5 ラテンアメリカのモバイルとデジタルヘルス技術市場規模推定と予測:技術別
12.5.1 ラテンアメリカのモバイルとデジタルヘルス技術市場規模推定と予測:テレヘルスケア別
12.5.2 ラテンアメリカのmHealth市場規模の推定と予測:技術別
12.5.3 ラテンアメリカのモバイルとデジタルヘルス技術予測:デジタルヘルスシステム別
12.6 ラテンアメリカのモバイルとデジタルヘルス技術市場規模推定と予測:コンポーネント別
12.7 ラテンアメリカのモバイルとデジタルヘルス技術規模の推定と予測:用途別
12.8 ラテンアメリカのモバイルとデジタルヘルス技術規模の推定と予測:エンドユーザー別
12.9 ブラジルのモバイルとデジタルヘルス技術分析
12.10 メキシコのモバイルとデジタルヘルス技術分析
12.11 アルゼンチンのモバイルとデジタルヘルス技術分析
12.12 コロンビアのモバイルとデジタルヘルス技術分析
12.13 その他のラテンアメリカのモバイルとデジタルヘルス技術分析
13 MEAのモバイルとデジタルヘルス技術の分析
13.1 主要な調査結果
13.2 MEAモバイルとデジタルヘルス技術の魅力度指数
13.3 MEAのモバイルとデジタルヘルス技術国別、2024年、2029年、2034年(US$ Billion)
13.4 MEAのモバイルとデジタルヘルス技術市場規模推定と予測:国別
13.5 MEAのモバイルとデジタルヘルス技術市場規模推定と予測:技術別
13.5.1 MEAのモバイルとデジタルヘルス技術市場規模推定と予測:遠隔医療別
13.5.2 MEAのモバイルとデジタルヘルス技術市場規模推定と予測:mHealth別
13.5.3 MEAのモバイルとデジタルヘルス技術市場規模推定と予測:デジタルヘルス技術別
13.6 MEAのモバイルとデジタルヘルス技術市場規模推定と予測:コンポーネント別
13.7 MEAのモバイルとデジタルヘルス技術市場規模推定と予測:用途別
13.8 MEAのモバイルとデジタルヘルス技術市場規模推定と予測:エンドユーザー別
13.9 GCCのモバイルとデジタルヘルス技術分析
13.10 南アフリカのモバイルとデジタルヘルス技術分析
13.11 MEAのその他の地域 モバイルとデジタルヘルス技術分析
14 主要企業のプロファイル
14.1 競争環境、2023年
14.2 戦略的展望
14.3 AdvancedMD, Inc.
14.3.1 会社概要
14.3.2 会社概要
14.3.3 製品ベンチマーク
14.3.4 戦略的展望
14.4 Allscripts Healthcare Solutions Inc. (Veradigm LLC)
14.4.1 会社概要
14.4.2 会社概要
14.4.3 財務分析
14.4.3.1 純収入、2017-2022年
14.4.3.2 売上高、2017-2021年
14.4.3.3 地域市場シェア、2022年
14.4.4 製品ベンチマーク
14.4.5 戦略的展望
14.5 Apple Inc.
14.5.1 会社概要
14.5.2 会社概要
14.5.3 財務分析
14.5.3.1 純収入、2017-2023年
14.5.3.2 R&D、2017年〜2023年
14.5.3.3 地域市場シェア、2023年
14.5.4 製品ベンチマーク
14.5.5 戦略的展望
14.6 Athenahealth, Inc.
14.6.1 会社概要
14.6.2 会社概要
14.6.3 製品ベンチマーク
14.6.4 戦略的展望
14.7 AT&T
14.7.1 会社概要
14.7.2 会社概要
14.7.3 財務分析
14.7.3.1 純収入(2017年~2023年
14.7.3.2 地域市場シェア(2023年
14.7.4 製品ベンチマーク
14.7.5 戦略的展望
14.8 BioTelemetry Inc.
14.8.1 会社概要
14.8.2 会社概要
14.8.3 財務分析
14.8.3.1 純収入、2017-2019年
14.8.3.2 R&D、2017年〜2019年
14.8.4 製品ベンチマーク
14.8.5 戦略的展望
14.9 Oracle (Cerner Corporation)
14.9.1 会社概要
14.9.2 会社概要
14.9.3 財務分析
14.9.3.1 純収入、2017-2023年
14.9.3.2 R&D、2017年~2023年
14.9.3.3 地域市場シェア、2023年
14.9.4 製品ベンチマーク
14.9.5 戦略的展望
14.10 Cisco Systems, Inc.
14.10.1 会社概要
14.10.2 会社概要
14.10.3 財務分析
14.10.3.1 純収入、2017-2023年
14.10.3.2 R&D、2017年~2023年
14.10.3.3 地域市場シェア、2023年
14.10.4 製品ベンチマーク
14.10.5 戦略的展望
14.11 eClinicalWorks
14.11.1 会社概要
14.11.2 会社概要
14.11.3 製品ベンチマーク
14.11.4 戦略的展望
14.12 Epic Systems Corporation.
14.12.1 会社概要
14.12.2 会社概要
14.12.3 製品ベンチマーク
14.12.4 戦略的展望
14.13 GE HealthCare.
14.13.1 会社概要
14.13.2 会社概要
14.13.3 財務分析
14.13.3.1 純収入、2017年~2023年
14.13.3.2 売上高、2017年~2023年
14.13.4 製品ベンチマーク
14.13.5 戦略的展望
14.14 IBM
14.14.1 会社概要
14.14.2 会社概要
14.14.3 財務分析
14.14.3.1 純収入(2017年~2023年
14.14.3.2 R&D、2017年~2023年
14.14.3.3 地域市場シェア、2023年
14.14.4 製品ベンチマーク
14.14.5 戦略的展望
14.15 IHealth Lab, Inc.
14.15.1 会社概要
14.15.2 会社概要
14.15.3 製品ベンチマーク
14.15.4 戦略的展望
14.16 Koninklijke Philips N.V.
14.16.1 会社概要
14.16.2 会社概要
14.16.3 財務分析
14.16.3.1 純収入(2017-2023年
14.16.3.2 R&D、2017年〜2023年
14.16.3.3 地域市場シェア、2023年
14.16.4 製品ベンチマーク
14.16.5 戦略的展望
14.17 McKesson Corporation
14.17.1 会社概要
14.17.2 会社概要
14.17.3 財務分析
14.17.3.1 純収入(2017年~2023年
14.17.3.2 地域市場シェア(2023年
14.17.4 製品ベンチマーク
14.17.5 戦略的展望
14.18 Omron Corporation
14.18.1 会社概要
14.18.2 会社概要
14.18.3 財務分析
14.18.3.1 純収入、2017年~2023年
14.18.3.2 R&D、2019-2023年
14.18.3.3 地域市場シェア、2023年
14.18.4 製品ベンチマーク
14.18.5 戦略的展望
14.19 Qualcomm Technologies, Inc.
14.19.1 会社概要
14.19.2 会社概要
14.19.3 財務分析
14.19.3.1 純収入(2017年〜2023年
14.19.4 製品ベンチマーク
14.19.5 戦略的展望
14.20 Samsung
14.20.1 会社概要
14.20.2 会社概要
14.20.3 財務分析
14.20.3.1 純収入、2017年~2023年
14.20.4 製品ベンチマーク
14.20.5 戦略的展望
14.21 Siemens Healthineers AG
14.21.1 会社概要
14.21.2 会社概要
14.21.3 財務分析
14.21.3.1 純収入(2017年~2023年
14.21.3.2 売上高、2019-2023年
14.21.3.3 地域市場シェア、2023年
14.21.4 製品ベンチマーク
14.21.5 戦略的展望
14.22 Telefónica IoT & Big Data Tech, S.A.U.
14.22.1 会社概要
14.22.2 会社概要
14.22.3 財務分析
14.22.3.1 純収入、2017年~2023年
14.22.4 製品ベンチマーク
14.22.5 戦略的展望
15 結論と提言
15.1 Visiongainからの結びの言葉
15.2 市場プレイヤーへの提言
ページTOPに戻る
図表リスト
表の一覧
表1 モバイルおよびデジタルヘルス技術のスナップショット、2024年~2034年(10億米ドル、CAGR)
表2 モバイルおよびデジタルヘルス技術の地域別予測、2024~2034年(10億米ドル、AGR%、CAGR%):「V字型回復
表3 2024~2034年のモバイルおよびデジタルヘルス技術の地域別予測(10億米ドル、AGR%、CAGR%):「U字型回復
表4 2024~2034年のモバイルおよびデジタルヘルス技術の地域別予測(10億米ドル、AGR%、CAGR%):「W字型回復
表5 2024~2034年のモバイルおよびデジタルヘルス技術の地域別予測(10億米ドル、AGR%、CAGR%):「L字型回復
表6 モバイルおよびデジタルヘルス技術の技術別予測、2024~2034年(10億米ドル、AGR%、CAGR)
表7 モバイルおよびデジタルヘルス技術のテレヘルスケア別予測、2024~2034年(10億米ドル、AGR%、CAGR)
表8 テレヘルスケア分野の地域別市場予測、2024~2034年(10億米ドル、AGR%、CAGR)
表9 モバイルとデジタルヘルス技術のテレケア別市場予測、2024~2034年(10億米ドル、AGR%、CAGR)
表10 モバイルおよびデジタルヘルス技術の地域別市場予測、2024-2034年(10億米ドル、AGR%、CAGR)
表11 モバイルとデジタルヘルス技術の市場予測:テレヘルス別、2024~2034年(10億米ドル、AGR%、CAGR)
表12 活動モニタリングセグメントの地域別市場予測、2024~2034年(10億米ドル、AGR%、CAGR)
表13 遠隔服薬管理セグメントの地域別市場予測、2024~2034年(10億米ドル、AGR%、CAGR)
表14 遠隔医療セグメントの地域別市場予測、2024-2034年(10億米ドル、AGR%、CAGR)
表15 LTCモニタリングセグメントの地域別市場予測、2024-2034年(10億米ドル、AGR%、CAGR)
表16 ビデオ診察セグメントの地域別市場予測、2024~2034年(10億米ドル、AGR%、CAGR)
表17 mHealthによるモバイル・デジタルヘルス技術の予測、2024~2034年(10億米ドル、AGR%、CAGR %)
表18 mHealthセグメントの地域別市場予測、2024~2034年(10億米ドル、AGR%、CAGR)
表19 ウェアラブル別のモバイル・デジタルヘルス技術市場予測、2024~2034年(10億米ドル、AGR%、CAGR)
表20 ウェアラブルセグメント地域別市場予測、2024-2034年(10億米ドル、AGR%、CAGR)
表21 BPモニターセグメント地域別市場予測、2024-2034年(10億米ドル、AGR%、CAGR)
表22 血糖値測定器セグメント地域別市場予測、2024-2034年(10億米ドル、AGR%、CAGR)
表23 パルス酸素濃度計セグメント地域別市場予測、2024-2034年 (10億米ドル、AGR%、CAGR %)
表24 睡眠時無呼吸モニターセグメント地域別市場予測、2024-2034年(10億米ドル、AGR%、CAGR)
表25 神経モニターセグメントの地域別市場展望、2024~2034年 (10億米ドル、AGR%、CAGR %)
表26 その他セグメントの地域別市場予測、2024-2034年(10億米ドル、AGR%、CAGR)
表27 アプリ別モバイル・デジタルヘルス技術市場予測、2024-2034年(10億米ドル、AGR%、CAGR)
表28 アプリセグメントの地域別市場予測、2024年~2034年(10億米ドル、AGR%、CAGR)
表29 医療アプリセグメントの地域別市場予測、2024年~2034年(10億米ドル、AGR%、CAGR)
表30 フィットネスアプリセグメントの地域別市場予測、2024年~2034年(10億米ドル、AGR%、CAGR)
表31 デジタルヘルスシステム別モバイル・デジタルヘルス技術市場予測、2024-2034年(10億米ドル、AGR%、CAGR %)
表32 電子カルテセグメントの地域別市場予測、2024〜2034年(10億米ドル、AGR%、CAGR)
表33 電子処方システムセグメントの地域別市場予測、2024-2034年(10億米ドル、AGR%、CAGR)
表34 ヘルスアナリティクスセグメントの地域別市場予測、2024-2034年(10億米ドル、AGR%、CAGR)
表35 モバイルおよびデジタルヘルス技術コンポーネント、2024年〜2034年(10億米ドル、AGR%、CAGR)
表36 地域別ハードウェア市場予測、2024〜2034年(10億米ドル、AGR%、CAGR)
表37 2024〜2034年の地域別ソフトウェア市場予測(10億米ドル、AGR%、CAGR)
表38 地域別サービス市場予測、2024年~2034年(10億米ドル、AGR%、CAGR)
表39 アプリケーション別モバイル・デジタルヘルス技術 2024-2034年(10億米ドル、AGR%、CAGR)
表40 心臓病学の地域別市場予測、2024〜2034年(10億米ドル、AGR%、CAGR)
表41 糖尿病市場の地域別予測、2024-2034年(10億米ドル、AGR%、CAGR)
表42 肥満の地域別市場予測、2024〜2034年(10億米ドル、AGR%、CAGR)
表43 神経学の地域別市場予測、2024〜2034年(10億米ドル、AGR%、CAGR)
表44 睡眠時無呼吸症候群の地域別市場予測、2024〜2034年(10億米ドル、AGR%、CAGR)
表45 その他の地域別市場予測、2024〜2034年(10億米ドル、AGR%、CAGR)
表46 モバイルおよびデジタルヘルス技術のエンドユーザー、2024〜2034年(10億米ドル、AGR%、CAGR)
表47 医療提供者の地域別市場予測、2024-2034年(10億米ドル、AGR%、CAGR)
表48 医療費支払者の地域別市場予測、2024-2034年(10億米ドル、AGR%、CAGR)
表49 医療消費者市場の地域別予測、2024-2034年(10億米ドル、AGR%、CAGR)
表50 その他市場の地域別予測、2024-2034年(10億米ドル、AGR%、CAGR)
表51 モバイルおよびデジタルヘルス技術の地域別予測、2024~2034年(10億米ドル、AGR%、CAGR)
表52 北米のモバイルおよびデジタルヘルス技術の国別予測、2024~2034年(10億米ドル、AGR%、CAGR)
表53 北米のモバイルおよびデジタルヘルス技術の技術別予測、2024~2034年(10億米ドル、AGR%、CAGR)
表54 北米のモバイルおよびデジタルヘルス技術:遠隔ヘルスケア別予測、2024~2034年(10億米ドル、AGR%、CAGR)
表55 北米のモバイルおよびデジタルヘルス技術:mHealth別予測、2024~2034年(10億米ドル、AGR%、CAGR)
表56 北米のモバイルおよびデジタルヘルス技術:デジタルヘルスシステム別予測、2024~2034年(10億米ドル、AGR%、CAGR)
表57 北米のモバイルおよびデジタルヘルス技術のコンポーネント別予測、2024~2034年(10億米ドル、AGR%、CAGR)
表58 北米のモバイルおよびデジタルヘルス技術用途別:2024~2034年(10億米ドル、AGR%、CAGR)
表59 北米のモバイルおよびデジタルヘルス技術のエンドユーザー2024~2034年(10億米ドル、AGR%、CAGR)
表60 米国のモバイルおよびデジタルヘルス技術の予測、2024~2034年(10億米ドル、AGR%、CAGR)
表61 カナダのモバイルおよびデジタルヘルス技術の予測、2024~2034年(10億米ドル、AGR%、CAGR %)
表62 欧州のモバイルおよびデジタルヘルス技術の国別予測、2024~2034年(10億米ドル、AGR%、CAGR)
表63 欧州のモバイルおよびデジタルヘルス技術の技術別予測、2024~2034年(10億米ドル、AGR%、CAGR)
表64 欧州のモバイルおよびデジタルヘルス技術市場:テレヘルスケア別予測、2024-2034年(10億米ドル、AGR%、CAGR %)
表65 欧州のモバイル・デジタルヘルス技術市場予測:mHealth別、2024~2034年(10億米ドル、AGR%、CAGR)
表66 欧州のモバイルおよびデジタルヘルス技術市場:デジタルヘルスシステム別予測、2024年~2034年(10億米ドル、AGR%、CAGR)
表67 欧州のモバイルおよびデジタルヘルス技術コンポーネント別市場:2024-2034年(10億米ドル、AGR%、CAGR)
表 68 欧州のモバイルおよびデジタルヘルス技術:アプリケーション別 2024-2034 (10億米ドル, AGR%, CAGR%)
表69 欧州のモバイルおよびデジタルヘルス技術のエンドユーザー 2024-2034 (10億米ドル, AGR%, CAGR%)
表70 ドイツのモバイルおよびデジタルヘルス技術の予測、2024年~2034年(10億米ドル、AGR%、CAGR)
表71 フランスのモバイルおよびデジタルヘルス技術の予測、2024年~2034年(10億米ドル、AGR%、CAGR %)
表72 イギリスのモバイルとデジタルヘルス技術の予測、2024年~2034年(10億米ドル、AGR%、CAGR)
表73 イタリアのモバイルとデジタルヘルス技術の予測、2024年~2034年(10億米ドル、AGR%、CAGR %)
表74 スペインのモバイルおよびデジタルヘルス技術の予測、2024年~2034年(10億米ドル、AGR%、CAGR %)
表75 ロシアのモバイルおよびデジタルヘルス技術の予測、2024年~2034年(10億米ドル、AGR%、CAGR)
表 76 ポーランドのモバイルとデジタルヘルス技術の予測、2024~2034年(10億米ドル、AGR%、CAGR)
表77 ベルギーのモバイルおよびデジタルヘルス技術の予測、2024年~2034年(10億米ドル、AGR%、CAGR)
表78 その他のヨーロッパのモバイルおよびデジタルヘルス技術の予測、2024年~2034年(10億米ドル、AGR%、CAGR)
表79 アジア太平洋地域のモバイルおよびデジタルヘルス技術の国別予測、2024~2034年(10億米ドル、AGR%、CAGR)
表80 アジア太平洋地域のモバイルおよびデジタルヘルス技術の技術別予測、2024~2034年(10億米ドル、AGR%、CAGR)
表81 アジア太平洋地域のモバイルおよびデジタルヘルス技術市場:遠隔医療(Tele-healthcare)別予測、2024年~2034年(10億米ドル、AGR%、CAGR %)
表82 アジア太平洋地域のモバイルおよびデジタルヘルス技術市場予測:mHealth別、2024~2034年(10億米ドル、AGR%、CAGR %)
表83 アジア太平洋地域のモバイル・デジタルヘルス技術市場予測:デジタルヘルスシステム別、2024年~2034年(10億米ドル、AGR%、CAGR)
表84 アジア太平洋地域のモバイルおよびデジタルヘルス技術のコンポーネント別市場予測、2024年~2034年(10億米ドル、AGR%、CAGR)
表85 アジア太平洋地域のモバイルおよびデジタルヘルス技術のアプリケーション別2024-2034年(10億米ドル、AGR%、CAGR)
表86 アジア太平洋地域のモバイルおよびデジタルヘルス技術のエンドユーザー 2024-2034年 (10億米ドル、AGR%、CAGR)
表87 日本のモバイルおよびデジタルヘルス技術の予測、2024年~2034年(10億米ドル、AGR%、CAGR)
表88 中国のモバイルとデジタルヘルス技術の予測、2024年~2034年(10億米ドル、AGR%、CAGR)
表89 インドのモバイルとデジタルヘルス技術の予測、2024年~2034年(10億米ドル、AGR%、CAGR %)
表90 オーストラリアのモバイルとデジタルヘルス技術の予測、2024年~2034年(10億米ドル、AGR%、CAGR)
表91 韓国のモバイルおよびデジタルヘルス技術の予測、2024年~2034年(10億米ドル、AGR%、CAGR)
表92 シンガポールのモバイルとデジタルヘルス技術の予測、2024年~2034年(10億米ドル、AGR%、CAGR %)
表93 台湾のモバイルおよびデジタルヘルス技術の予測、2024年~2034年(10億米ドル、AGR%、CAGR)
表94 その他のアジア太平洋地域のモバイルおよびデジタルヘルス技術の予測、2024年~2034年(10億米ドル、AGR%、CAGR)
表95 ラテンアメリカのモバイルおよびデジタルヘルス技術の国別予測、2024~2034年(10億米ドル、AGR%、CAGR)
表96 ラテンアメリカのモバイルおよびデジタルヘルス技術の技術別予測、2024~2034年(10億米ドル、AGR%、CAGR)
表97 ラテンアメリカのモバイルおよびデジタルヘルス技術:遠隔ヘルスケア別予測、2024~2034年(10億米ドル、AGR%、CAGR)
表98 ラテンアメリカのモバイルおよびデジタルヘルス技術:mHealth別予測、2024~2034年(10億米ドル、AGR%、CAGR)
表99 ラテンアメリカのモバイルおよびデジタルヘルス技術:デジタルヘルスシステム別予測、2024~2034年(10億米ドル、AGR%、CAGR)
表100 ラテンアメリカのモバイルおよびデジタルヘルス技術コンポーネント別予測、2024年~2034年(10億米ドル、AGR%、CAGR)
表101 ラテンアメリカのモバイルおよびデジタルヘルス技術用途別:2024-2034年(10億米ドル、AGR%、CAGR)
表102 ラテンアメリカのモバイルおよびデジタルヘルス技術 エンドユーザー 2024-2034 (10億米ドル, AGR%, CAGR%)
表103 ブラジルのモバイルおよびデジタルヘルス技術の予測、2024年~2034年(10億米ドル、AGR%、CAGR %)
表104 メキシコのモバイルとデジタルヘルス技術の予測、2024~2034年(10億米ドル、AGR%、CAGR)
表105 アルゼンチンのモバイルとデジタルヘルス技術の予測、2024~2034年(10億米ドル、AGR%、CAGR)
表106 コロンビアのモバイルおよびデジタルヘルス技術の予測、2024~2034年(10億米ドル、AGR%、CAGR)
表107 ラテンアメリカの残りの地域 モバイルおよびデジタルヘルス技術の予測、2024年~2034年(10億米ドル、AGR%、CAGR)
表108 MEAのモバイルおよびデジタルヘルス技術の国別予測、2024~2034年(10億米ドル、AGR%、CAGR)
表109 MEAのモバイルおよびデジタルヘルス技術の技術別予測、2024~2034年(億米ドル、AGR%、CAGR)
表110 MEAのモバイルおよびデジタルヘルス技術:遠隔医療別市場規模予測および予測、2024~2034年(10億米ドル、AGR%、CAGR)
表111 MEAモバイル・デジタルヘルス技術:mHealth別市場規模予測・予測(2024~2034年、10億ドル、AGR%、CAGR)
表112 MEAモバイルおよびデジタルヘルス技術:デジタルヘルスシステム別予測、2024~2034年(10億米ドル、AGR%、CAGR)
表113 MEAモバイルおよびデジタルヘルス技術のコンポーネント別予測、2024~2034年(10億米ドル、AGR%、CAGR)
表114 MEAのモバイルおよびデジタルヘルス技術:用途別2024-2034年(10億米ドル、AGR%、CAGR)
表115 MEAのモバイルおよびデジタルヘルス技術のエンドユーザー 2024-2034年 (10億米ドル、AGR%、CAGR)
表116 GCCのモバイルおよびデジタルヘルス技術の予測、2024~2034年(10億米ドル、AGR%、CAGR)
表117 南アフリカのモバイルおよびデジタルヘルス技術の予測、2024年~2034年(10億米ドル、AGR%、CAGR)
表118 MEAの残りの地域 モバイルおよびデジタルヘルス技術の予測、2024年~2034年(10億米ドル、AGR%、CAGR)
表119 戦略的展望
表120 AdvancedMD, Inc:主な詳細(CEO, 本社, 売上高, 設立, 従業員数, 企業タイプ, ウェブサイト, 事業セグメント)
表121 AdvancedMD, Inc:製品ベンチマーク
表122 アドバンストMD, Inc:戦略的展望
表123 オールスクリプツ・ヘルスケア・ソリューションズ社(Veradigm LLC):主な詳細(CEO、本社、売上高、設立、従業員数、企業タイプ、ウェブサイト、事業セグメント)
表 124 オールスクリプツ・ヘルスケア・ソリューションズ Inc:製品ベンチマーク
表 125 オールスクリプツ・ヘルスケア・ソリューションズ Inc:戦略的展望
表126 アップル社主な詳細(CEO, 本社, 売上高, 設立, 従業員数, 企業タイプ, ウェブサイト, 事業セグメント)
表 127 アップル社製品ベンチマーク
表128 アップル戦略的展望
表129 アテナヘルスInc:主な詳細(CEO, 本社, 売上高, 設立, 従業員数, 企業タイプ, ウェブサイト, 事業セグメント)
表 130 Athenahealth, Inc:製品のベンチマーク
表 131 Athenahealth, Inc:戦略的展望
表132 AT&T:主な詳細(CEO、本社、売上高、設立、従業員数、企業タイプ、ウェブサイト、事業セグメント)
表133 AT&T:製品ベンチマーク
表134 AT&T:戦略的展望
表135 バイオテレメトリー社主な詳細(CEO, 本社, 売上高, 設立, 従業員数, 企業タイプ, ウェブサイト, 事業セグメント)
表 136 バイオテレメトリー社製品ベンチマーク
表 137 バイオテレメトリー社戦略的展望
表138 オラクル(サーナー・コーポレーション)の主要な詳細(CEO、本社、売上高、設立、従業員数、企業タイプ、ウェブサイト、事業セグメント)
表139 オラクル(サーナー・コーポレーション):製品ベンチマーク
表140 オラクル(サーナー・コーポレーション):戦略的展望
表141 Cisco Systems, Inc.の主な詳細(CEO、本社、売上高、設立、従業員数、企業タイプ、ウェブサイト、事業セグメント)
表142 シスコシステムズ、製品ベンチマーク
表143 シスコシステムズ、戦略的展望
表144 EClinicalWorks:主な詳細(CEO, 本社, 売上高, 設立, 従業員数, 企業タイプ, ウェブサイト, 事業セグメント)
表 145 EClinicalWorks:製品ベンチマーク
表 146 EClinicalWorks:戦略的展望
表147 Epic Systems Corporation:主な詳細 (CEO, 本社, 売上高, 設立, 従業員数, 企業タイプ, ウェブサイト, 事業セグメント)
表 148 Epic Systems Corporation:製品ベンチマーク
表 149 Epic Systems Corporation:戦略的展望
表 150 GE ヘルスケア; 主要な詳細(CEO, 本社, 売上高, 設立, 従業員数, 企業タイプ, ウェブサイト, 事業セグメント)
表151 GEヘルスケア:製品ベンチマーク
表152 GEヘルスケア:戦略的展望
表153 IBM ;主要業績詳細(CEO, 本社, 売上高, 設立, 従業員数, 企業タイプ, ウェブサイト, 事業セグメント)
表154 IBM:製品ベンチマーク
表155 IBM;戦略的展望
表156 IHealth Lab, Inc:主な詳細(CEO、本社、売上高、設立、従業員数、会社タイプ、ウェブサイト、事業セグメント)
表157 IHealth Lab, Inc:製品ベンチマーク
表158 IHealth Lab, Inc:戦略的展望
表159 Koninklijke Philips N.V.:主要詳細(CEO、本社、売上高、設立、従業員数、企業タイプ、ウェブサイト、事業セグメント)
表160 Koninklijke Philips N.V:製品ベンチマーク
表161 Koninklijke Philips N.V.:戦略的展望
表162 マッケソン・コーポレーション主な詳細(CEO, 本社, 売上高, 設立, 従業員数, 企業タイプ, ウェブサイト, 事業セグメント)
表 163 マッケソン・コーポレーション製品ベンチマーク
表 164 マッケソン・コーポレーション戦略的展望
表165 オムロン株式会社主な詳細(CEO, 本社, 売上高, 設立, 従業員数, 企業タイプ, ウェブサイト, 事業セグメント)
表 166 オムロン株式会社製品ベンチマーク
表 167 オムロン株式会社戦略的展望
表168 Qualcomm Technologies, Inc:主な詳細(CEO、本社、売上高、設立、従業員数、企業タイプ、ウェブサイト、事業セグメント)
表 169 Qualcomm Technologies, Inc:製品ベンチマーク
表170 Qualcomm Technologies, Inc:戦略的展望
表171 Samsung:主な詳細(CEO、本社所在地、売上高、設立、従業員数、企業タイプ、ウェブサイト、事業セグメント)
表172 サムスン製品ベンチマーク
表173 サムスン:戦略的展望
表174 シーメンス・ヘルスィニアースAG:主要業績(CEO、本社所在地、売上高、設立、従業員数、企業タイプ、ウェブサイト、事業セグメント)
表 175 Siemens Healthineers AG: 製品ベンチマーク
表176 シーメンス・ヘルティニアスAG:戦略的展望
表177 Telefónica IoT & Big Data Tech, S.A.U:主な詳細(CEO, 本社, 売上高, 設立, 従業員数, 企業タイプ, ウェブサイト, 事業セグメント)
表 178 Telefónica IoT & Big Data Tech, S.A.U:製品ベンチマーク
表179 Telefónica IoT & Big Data Tech, S.A.U:戦略的展望
表179 Telefónica IoT & Big Data Tech, S.A.U;
図の一覧
図1 モバイルおよびデジタルヘルス技術のセグメンテーション
図2 技術別モバイルおよびデジタルヘルス技術市場:市場魅力度指数
図3 モバイル・デジタルヘルス技術:コンポーネント別:市場魅力度指数
図4 アプリケーション別モバイル・デジタルヘルス技術市場:市場魅力度指数市場魅力度指数
図5 エンドユーザー別モバイル・デジタルヘルス技術:市場魅力度指数市場魅力度指数
図6 モバイル・デジタルヘルス技術:地域別市場魅力度指数
図7 モバイル・デジタルヘルス技術市場ダイナミクス
図8 2024~2034年の地域別モバイル・デジタルヘルス技術(10億米ドル、AGR %):「V字型回復
図9 2024-2034年地域別モバイルおよびデジタルヘルス技術(10億米ドル、AGR %):「U字型回復
図 10 2024-2034 年地域別モバイルおよびデジタルヘルス技術(10 億米ドル、AGR %):「W字型回復
図 11 2024-2034 年におけるモバイルおよびデジタルヘルス技術(地域別)(10 億米ドル、AGR %):「L字型回復
図12 モバイルおよびデジタルヘルス技術市場ポーターのファイブフォース分析
図13 モバイルおよびデジタルヘルス技術:PEST分析
図14 モバイルおよびデジタルヘルス技術:技術別市場魅力度指数
図15 モバイルおよびデジタルヘルス技術の技術別予測、2024年~2034年(10億米ドル、AGR %)
図16 モバイルおよびデジタルヘルス技術の技術別シェア予測、2024年、2029年、2034年(%)
図17 テレヘルスケア別のモバイルおよびデジタルヘルス技術の予測、2024年~2034年(10億米ドル、AGR %)
図18 テレヘルスケア別モバイルおよびデジタルヘルス技術シェア予測、2024年、2034年(%)
図19 テレケア別のモバイルおよびデジタルヘルス技術市場予測、2024年~2034年 (10億米ドル、AGR %)
図20 テレケアセグメントの地域別市場予測、2024年~2034年 (10億米ドル、AGR %)
図21 テレケアセグメントの地域別市場予測、2024年&2034年(%)
図22 テレヘルス別モバイル・デジタルヘルス技術市場予測、2024年〜2034年 (10億米ドル、AGR %)
図23 活動モニタリングセグメントの地域別市場予測、2024年~2034年 (10億米ドル, AGR %)
図24 活動モニタリングセグメントの地域別市場予測、2024年~2034年(%)
図25 遠隔服薬管理セグメントの地域別市場予測、2024~2034年 (10億米ドル、AGR %)
図26 遠隔服薬管理セグメントの地域別市場シェア予測、2024年〜2034年(%)
図27 遠隔医療セグメントの地域別市場予測、2024~2034年 (10億米ドル、AGR %)
図28 テレヘルスセグメントの地域別市場シェア予測、2024年&2034年(%)
図29 LTCモニタリングセグメントの地域別市場予測、2024~2034年 (10億米ドル、AGR %)
図30 LTCモニタリングセグメントの地域別市場シェア予測、2024年~2034年(%)
図31 ビデオコンサルテーションセグメントの地域別市場予測、2024~2034年 (10億米ドル, AGR %)
図32 2024〜2034年ビデオ診察セグメント地域別市場シェア予測(%)
図33 モバイルおよびデジタルヘルス技術のmHealth別市場予測、2024年~2034年(10億米ドル、AGR)
図34 モバイルおよびデジタルヘルス技術のmHealth別市場予測、2024年、2034年(%)
図35 ウェアラブル別モバイル・デジタルヘルス技術市場予測、2024~2034年(10億米ドル、AGR %)
図36 ウェアラブルセグメント地域別市場予測、2024年~2034年 (10億米ドル, AGR %)
図37 ウェアラブル端末セグメントの地域別市場予測、2024年~2034年 (%)
図38 2024~2034年の地域別BPモニターセグメント市場予測(10億米ドル、AGR)
図 39 2024-2034 年における BP モニターの地域別市場シェア予測 (%)
図 40 2024-2034 年地域別ブドウ糖測定器セグメント市場予測(10 億米ドル、AGR)
図 41 2024-2034 年グルコースメーター地域別市場シェア予測 (%)
図42 パルス酸素濃度計セグメント地域別市場予測、2024~2034年 (10億米ドル、AGR %)
図43 パルス酸素濃度計セグメント地域別市場シェア予測、2024年~2034年(%)
図44 睡眠時無呼吸症候群モニターの地域別市場予測、2024~2034年 (10億米ドル、AGR %)
図 45 2024-2034 年睡眠時無呼吸モニター地域別市場シェア予測 (%)
図 46 2024-2034 年地域別神経学的モニター市場予測 (10 億米ドル, AGR %)
図 47 2024-2034 年地域別神経モニターセグメント市場シェア予測 (%)
図 48 2024-2034 年地域別その他セグメント市場予測 (US$ Billion, AGR %)
図49 その他セグメントの地域別市場シェア予測、2024年〜2034年(%)
図50 アプリ別モバイル・デジタルヘルス技術市場予測、2024~2034年 (10億米ドル, AGR %)
図51 アプリセグメントの地域別市場予測、2024年~2034年 (10億米ドル、AGR %)
図52 アプリセグメントの地域別市場予測、2024年~2034年(%)
図53 医療アプリセグメントの地域別市場予測、2024~2034年 (10億米ドル、AGR %)
図54 医療アプリセグメントの地域別市場シェア予測、2024年~2034年(%)
図55 2024~2034年フィットネスアプリセグメント地域別市場予測(10億米ドル、AGR)
図56 2024年~2034年の地域別フィットネスアプリセグメント市場シェア予測(%)
図57 デジタルヘルスシステム別モバイル・デジタルヘルス技術市場予測、2024年~2034年(10億米ドル、AGR)
図 58 デジタルヘルス・システム別のモバイルおよびデジタルヘルス技術の市場予測、2024 年、2034 年 (%)
図59 電子カルテセグメントの地域別市場予測、2024~2034年 (10億米ドル、AGR %)
図60 電子カルテセグメントの地域別市場予測、2024年&2034年(%)
図61 電子処方箋システムセグメントの地域別市場予測、2024~2034年 (10億米ドル、AGR %)
図62 電子処方箋システムの地域別市場シェア予測、2024年〜2034年(%)
図63 ヘルスアナリティクスセグメントの地域別市場予測、2024~2034年 (10億米ドル、AGR %)
図64 ヘルスアナリティクスセグメントの地域別市場シェア予測、2024年&2034年(%)
図65 コンポーネント別モバイル・デジタルヘルス技術市場魅力度指数
図66 モバイルおよびデジタルヘルス技術のコンポーネント別予測、2024年~2034年(10億米ドル、AGR)
図67 2024年、2029年、2034年のモバイルおよびデジタルヘルス技術のコンポーネント別シェア予測(%)
図68 地域別ハードウェアセグメント市場予測(2024~2034年、10億米ドル、AGR)
図69 地域別ハードウェアセグメント市場予測、2024年&2034年(%)
図70 2024~2034年の地域別ソフトウェア市場予測(10億米ドル、AGR)
図71 地域別ソフトウェア市場シェア予測、2024年~2034年(%)
図72 2024~2034年地域別サービス市場予測(10億米ドル、AGR)
図73 地域別サービス市場シェア予測、2024年~2034年(%)
図74 アプリケーション別モバイル・デジタルヘルス技術市場魅力度指数
図75 モバイルおよびデジタルヘルス技術の用途別予測(2024~2034年、10億米ドル、AGR)
図76 2024年、2029年、2034年のモバイルおよびデジタルヘルス技術の用途別市場シェア予測(%)
図77 心臓病学の地域別市場予測、2024年~2034年(10億米ドル、AGR %)
図78 心臓病学の地域別市場シェア予測、2024年&2034年(%)
図79 糖尿病の地域別市場展望、2024~2034年 (10億米ドル, AGR %)
図80 糖尿病の地域別市場展望、2024年〜2034年(%)
図81 肥満の地域別市場展望、2024~2034年 (10億米ドル, AGR %)
図82 肥満の地域別市場展望、2024年〜2034年(%)
図83 神経科領域の地域別市場展望、2024~2034年 (10億米ドル, AGR %)
図84 神経内科セグメントの地域別市場シェア予測、2024年〜2034年(%)
図85 睡眠時無呼吸症候群の地域別市場予測、2024〜2034年 (10億米ドル、AGR %)
図86 睡眠時無呼吸症候群セグメントの地域別市場シェア予測、2024年〜2034年 (%)
図87 その他の地域別市場予測、2024〜2034年 (10億米ドル、AGR %)
図88 その他セグメントの地域別市場シェア予測、2024年〜2034年(%)
図89 エンドユーザー別モバイル・デジタルヘルス技術市場魅力度指数
図90 エンドユーザー別モバイル・デジタルヘルス技術市場予測(2024~2034年、10億米ドル、AGR)
図91 エンドユーザー別モバイル・デジタルヘルス技術市場シェア予測(2024年、2029年、2034年)(%)
図92 医療提供者セグメントの地域別市場予測、2024年~2034年(10億米ドル、AGR %)
図93 医療提供者セグメントの地域別市場予測、2024年&2034年(%)
図94 医療費支払者の地域別市場予測、2024~2034年(10億米ドル、AGR)
図95 医療費支払者の地域別市場シェア予測、2024年&2034年(%)
図96 医療消費者セグメントの地域別市場予測(2024年~2034年、10億米ドル、AGR)
図97 医療消費者セグメントの地域別市場予測、2024年〜2034年(%)
図98 その他セグメントの地域別市場展望、2024~2034年 (10億米ドル, AGR %)
図99 その他セグメントの地域別市場シェア予測、2024年〜2034年(%)
図100 2023年および2033年のモバイルおよびデジタルヘルス技術の地域別予測(売上高, CAGR)
図101 モバイルおよびデジタルヘルス技術の地域別市場シェア予測、2024年、2029年、2034年(%)
図102 2024年~2034年のモバイルおよびデジタルヘルス技術の地域別市場予測(億米ドル、AGR)
図103 北米のモバイルおよびデジタルヘルス技術の魅力度指数
図104 北米のモバイルおよびデジタルヘルス技術(地域別)、2024年、2029年&2034年(10億米ドル
図105 北米のモバイルおよびデジタルヘルス技術の国別予測、2024~2034年(10億米ドル、AGR)
図106 北米のモバイルおよびデジタルヘルス技術の国別シェア予測、2024年&2034年(%)
図107 北米のモバイルおよびデジタルヘルス技術の技術別予測、2024~2034年(10億米ドル、AGR)
図108 北米のモバイルおよびデジタルヘルス技術の技術別シェア予測、2024年&2034年(%)
図109 北米のモバイルおよびデジタルヘルス技術:遠隔ヘルスケア別予測、2024~2034年(10億米ドル、AGR)
図110 北米のモバイル・デジタルヘルス技術:mHealth別予測、2024~2034年(10億米ドル、AGR)
図111 北米のモバイルおよびデジタルヘルス技術:デジタルヘルスシステム別予測、2024~2034年(10億米ドル、AGR)
図112 北米のモバイルおよびデジタルヘルス技術:コンポーネント別予測、2024年~2034年(10億米ドル、AGR)
図113 北米のモバイルおよびデジタルヘルス技術のコンポーネント別シェア予測、2024年&2034年(%)
図114 北米のモバイルおよびデジタルヘルス技術の用途別予測、2024~2034年(10億米ドル、AGR)
図 115 北米のモバイルおよびデジタルヘルス技術の用途別シェア予測、2024年 & 2034年 (%)
図116 北米のモバイルおよびデジタルヘルス技術のエンドユーザー別予測、2024~2034年(10億米ドル、AGR)
図 117 北米のモバイル/デジタルヘルス技術のエンドユーザー別予測、2024年~2034年 (%)
図118 米国のモバイルおよびデジタルヘルス技術の予測、2024~2034年(10億米ドル、AGR)
図 119 カナダのモバイルおよびデジタルヘルス技術の予測、2024~2034年 (10億米ドル、AGR)
図 120 欧州のモバイルおよびデジタルヘルス技術の魅力度指数
図121 欧州のモバイルおよびデジタルヘルス技術の地域別予測(2024年、2029年、2034年) (億米ドル
図122 欧州のモバイル/デジタルヘルス技術の国別予測、2024~2034年(10億米ドル、AGR)
図 123 欧州のモバイルおよびデジタルヘルス技術の国別シェア予測、2024年&2034年 (%)
図124 欧州のモバイルおよびデジタルヘルス技術の技術別予測、2024~2034年 (10億米ドル、AGR %)
図125 欧州のモバイルおよびデジタルヘルス技術の技術別シェア予測、2024年 & 2034年 (%)
図126 欧州モバイル・デジタルヘルス技術市場予測(テレヘルスケア別)、2024~2034年 (10億米ドル、AGR %)
図127 欧州モバイル・デジタルヘルス技術市場:mHealth別予測、2024~2034年(10億米ドル、AGR)
図128 欧州モバイル・デジタルヘルス技術市場:デジタルヘルスシステム別予測、2024年~2034年 (10億米ドル、AGR %)
図129 欧州のモバイルおよびデジタルヘルス技術:コンポーネント別予測、2024~2034年 (10億米ドル、AGR)
図130 欧州のモバイルおよびデジタルヘルス技術のコンポーネント別シェア予測、2024年 & 2034年 (%)
図131 欧州のモバイルおよびデジタルヘルス技術の用途別予測、2024~2034年 (10億米ドル、AGR %)
図132 欧州のモバイルおよびデジタルヘルス技術の用途別シェア予測、2024年 & 2034年 (%)
図 133 欧州のモバイルおよびデジタルヘルス技術のエンドユーザー別予測、2024~2034年 (10億米ドル、AGR %)
図 134 欧州のモバイルおよびデジタルヘルス技術のエンドユーザー別予測、2024 年 ~ 2034 年(%)
図135 ドイツのモバイルおよびデジタルヘルス技術の予測、2024年~2034年(10億米ドル、AGR %)
図 136 フランスのモバイル/デジタルヘルス技術の予測、2024~2034年 (10億米ドル、AGR %)
図 137 英国のモバイルとデジタルヘルス技術の予測、2024~2034年 (10億米ドル, AGR %)
図 138 イタリアのモバイルとデジタルヘルス技術の予測、2024~2034年 (10億米ドル, AGR %)
図 139 スペインのモバイルとデジタルヘルス技術の予測、2024~2034年 (10億米ドル、AGR %)
図 140 ロシアのモバイルとデジタルヘルス技術の予測、2024~2034年 (10億米ドル, AGR %)
図141 ポーランドのモバイルとデジタルヘルス技術の予測、2024~2034年 (10億米ドル, AGR %)
図142 ベルギーのモバイルおよびデジタルヘルス技術の予測、2024~2034年 (10億米ドル、AGR %)
図143 その他のヨーロッパのモバイルとデジタルヘルス技術の予測、2024年~2034年(10億米ドル、AGR %)
図 144 アジア太平洋地域のモバイルおよびデジタルヘルス技術の魅力指数
図 145 アジア太平洋地域のモバイル/デジタルヘルス技術の地域別予測(2024年、2029年、2034年) (億米ドル
図146 アジア太平洋地域のモバイルおよびデジタルヘルス技術の国別予測、2024~2034年(10億米ドル、AGR)
図147 アジア太平洋地域のモバイルおよびデジタルヘルス技術の国別シェア予測、2024年&2034年(%)
図148 アジア太平洋地域のモバイルおよびデジタルヘルス技術の技術別予測、2024~2034年(10億米ドル、AGR)
図149 アジア太平洋地域のモバイルおよびデジタルヘルス技術の技術別シェア予測、2024年&2034年(%)
図150 アジア太平洋地域のモバイルおよびデジタルヘルス技術:遠隔ヘルスケア別予測、2024年〜2034年(10億米ドル、AGR)
図151 アジア太平洋地域のモバイル・デジタルヘルス技術市場:mHealth別予測(2024~2034年、10億米ドル、AGR)
図152 アジア太平洋地域のモバイルおよびデジタルヘルス技術市場:デジタルヘルスシステム別予測、2024年~2034年(10億米ドル、AGR)
図153 アジア太平洋地域のモバイルおよびデジタルヘルス技術:コンポーネント別市場予測(2024~2034年、10億米ドル、AGR)
図154 アジア太平洋地域のモバイルおよびデジタルヘルス技術のコンポーネント別シェア予測、2024年~2034年(%)
図155 アジア太平洋地域のモバイルおよびデジタルヘルス技術の用途別予測、2024~2034年(10億米ドル、AGR)
図156 アジア太平洋地域のモバイルおよびデジタルヘルス技術の用途別シェア予測、2024年~2034年(%)
図157 アジア太平洋地域のモバイルおよびデジタルヘルス技術のエンドユーザー別予測、2024年~2034年(10億米ドル、AGR)
図158 アジア太平洋地域のモバイルおよびデジタルヘルス技術のエンドユーザー別予測、2024年 & 2034年 (%)
図159 日本のモバイルおよびデジタルヘルス技術の予測、2024年~2034年(10億米ドル、AGR)
図 160 中国のモバイルとデジタルヘルス技術の予測、2024~2034年(10億米ドル、AGR)
図161 インドのモバイルとデジタルヘルス技術の予測、2024年~2034年 (10億米ドル, AGR %)
図 162 オーストラリアのモバイルとデジタルヘルス技術の予測、2024年~2034年 (10億米ドル, AGR %)
図 163 韓国のモバイルおよびデジタルヘルス技術の予測、2024~2034年 (10億米ドル, AGR %)
図164 シンガポールのモバイルおよびデジタルヘルス技術の予測、2024年~2034年 (10億米ドル, AGR %)
図 165 台湾のモバイルおよびデジタルヘルス技術の予測、2024年~2034年(10億米ドル、AGR)
図 166 その他のアジア太平洋地域のモバイルおよびデジタルヘルス技術の予測、2024年~2034年 (10億米ドル、AGR)
図 167 ラテンアメリカのモバイルおよびデジタルヘルス技術の魅力度指数
図168 ラテンアメリカのモバイルおよびデジタルヘルス技術の地域別予測(2024年、2029年、2034年) (億米ドル
図169 中南米のモバイルおよびデジタルヘルス技術の国別予測、2024~2034年(10億米ドル、AGR)
図170 中南米のモバイルおよびデジタルヘルス技術の国別シェア予測、2024年&2034年(%)
図171 中南米のモバイルおよびデジタルヘルス技術の技術別予測、2024~2034年(10億米ドル、AGR)
図172 中南米のモバイルおよびデジタルヘルス技術の技術別シェア予測、2024年~2034年(%)
図173 ラテンアメリカのモバイルおよびデジタルヘルス技術:遠隔ヘルスケア別予測、2024~2034年(10億米ドル、AGR)
図174 ラテンアメリカのモバイル・デジタルヘルス技術:mHealth別予測、2024~2034年(10億米ドル、AGR)
図175 中南米のモバイルおよびデジタルヘルス技術:デジタルヘルスシステム別予測、2024~2034年(10億米ドル、AGR)
図176 中南米のモバイルおよびデジタルヘルス技術:コンポーネント別予測、2024年~2034年(10億米ドル、AGR)
図177 中南米のモバイルおよびデジタルヘルス技術のコンポーネント別シェア予測、2024年~2034年(%)
図178 中南米のモバイルおよびデジタルヘルス技術の用途別予測、2024~2034年(10億米ドル、AGR)
図 179 中南米のモバイル/デジタルヘルス技術の用途別シェア予測、2024年~2034年 (%)
図180 ラテンアメリカのモバイルおよびデジタルヘルス技術のエンドユーザー別予測、2024~2034年 (億米ドル、AGR)
図181 中南米のモバイルおよびデジタルヘルス技術のエンドユーザー別シェア予測、2024年 & 2034年 (%)
図182 ブラジルのモバイル/デジタルヘルス技術予測、2024~2034年(10億米ドル、AGR)
図183 メキシコのモバイルおよびデジタルヘルス技術の予測、2024~2034年 (10億米ドル, AGR %)
図184 アルゼンチンのモバイルとデジタルヘルス技術の予測、2024~2034年 (10億米ドル, AGR %)
図185 コロンビアのモバイルおよびデジタルヘルス技術の予測、2024年~2034年 (10億米ドル, AGR %)
図186 その他のラテンアメリカのモバイルおよびデジタルヘルス技術の予測、2024年~2034年 (10億米ドル、AGR %)
図187 MEAモバイルおよびデジタルヘルス技術の魅力度指数
図188 MEAモバイルおよびデジタルヘルス技術の地域別予測(2024年、2029年、2034年)(10億米ドル
図189 MEAモバイルおよびデジタルヘルス技術の国別予測、2024年~2034年(10億米ドル、AGR)
図190 MEAモバイルおよびデジタルヘルス技術の国別シェア予測、2024年&2034年(%)
図191 MEAモバイルおよびデジタルヘルス技術の技術別予測、2024~2034年(10億米ドル、AGR)
図192 MEAモバイルおよびデジタルヘルス技術の技術別シェア予測、2024年~2034年(%)
図193 MEAのモバイルおよびデジタルヘルス技術:遠隔ヘルスケア別の市場規模予測および予測、2024年~2034年 (10億米ドル、AGR %)
図194 MEAモバイル・デジタルヘルス技術:mHealth別の市場規模予測・予測(2024~2034年、10億米ドル、AGR)
図195 MEAモバイルおよびデジタルヘルス技術:デジタルヘルスシステム別予測、2024~2034年 (億米ドル、AGR)
図196 MEAモバイルおよびデジタルヘルス技術のコンポーネント別予測、2024年~2034年(10億米ドル、AGR)
図197 MEAモバイルおよびデジタルヘルス技術のコンポーネント別予測、2024年~2034年(%)
図198 MEAモバイルおよびデジタルヘルス技術の用途別予測、2024~2034年(10億米ドル、AGR)
図199 MEAモバイルおよびデジタルヘルス技術の用途別予測、2024年~2034年(%)
図200 MEAモバイルおよびデジタルヘルス技術のエンドユーザー別予測、2024年~2034年(10億米ドル、AGR)
図201 MEAモバイルおよびデジタルヘルス技術のエンドユーザー別シェア予測、2024年~2034年 (%)
図202 GCCのモバイル/デジタルヘルス技術の予測、2024~2034年(10億米ドル、AGR)
図203 南アフリカのモバイル/デジタルヘルス技術の予測、2024年~2034年 (10億米ドル, AGR %)
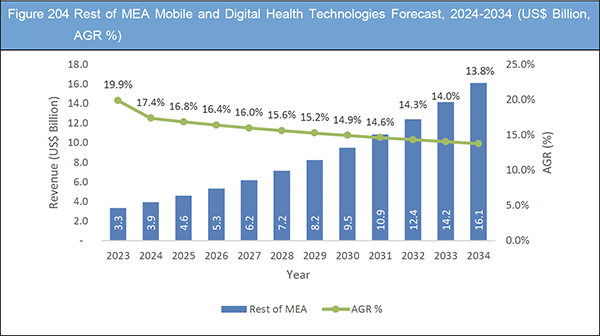
図204 MEAの残りの地域のモバイルおよびデジタルヘルス技術の予測、2024年~2034年 (10億米ドル、AGR %)
図205 モバイルおよびデジタルヘルス技術市場企業シェア(2023年
図 206 Allscripts Healthcare Solutions Inc:純収入、2017年-2022年(百万米ドル、AGR %)
図 207 オールスクリプツ・ヘルスケア・ソリューションズ社(Veradigm LLC):R&D、2017年-2021年(百万米ドル、AGR)
図 208 オールスクリプツ・ヘルスケア・ソリューションズ Inc:地域別市場シェア(%), 2022
図 209 Apple Inc:純収入、2017年~2023年(百万米ドル、AGR)
図 210 Apple Inc:R&D、2017年~2023年(百万米ドル、AGR)
図 211 アップル社:地域別市場シェア(%), 2023
図212 AT&T:純収入、2017年~2023年(百万米ドル、AGR)
図213 AT&T:地域別市場シェア(%)、2023年
図 214 BioTelemetry Inc:純収入、2017年~2019年(百万米ドル、AGR)
図 215 BioTelemetry Inc:R&D、2017年~2019年(百万米ドル、AGR)
図 216 オラクル(サーナー・コーポレーション):純収入、2017年~2023年(百万米ドル、AGR)
図 217 オラクル(サーナー・コーポレーション):R&D、2017年~2023年(百万米ドル、AGR)
図 218 オラクル(サーナー・コーポレーション):地域別市場シェア(%), 2023
図 219 シスコシステムズ, Inc:純収入、2017年~2023年(百万米ドル、AGR)
図 220 Cisco Systems, Inc:R&D、2017年-2023年(百万米ドル、AGR)
図 221 Cisco Systems, Inc:地域別市場シェア(%), 2023
図 222 GE ヘルスケア:純収入、2017年~2023年(百万米ドル、AGR)
図 223 GE HealthCare:R&D、2017年~2023年(百万米ドル、AGR)
図 224 IBM:純収入, 2017-2023 (百万米ドル, AGR%)
図 225 IBM:R&D、2017年~2023年(百万米ドル、AGR)
図 226 IBM:地域別市場シェア(%), 2023
図 227 Koninklijke Philips N.V:純収入、2017年~2023年 (百万米ドル, AGR%)
図 228 Koninklijke Philips N.V:R&D、2017-2023年(百万米ドル、AGR)
図 229 Koninklijke Philips N.V:地域別市場シェア(%), 2023
図 230 マッケソン・コーポレーション純収入、2017年~2023年(百万米ドル、AGR)
図 231 マッケソン・コーポレーション地域別市場シェア(%), 2023
図 232 オムロン株式会社:純収入、2017年~2023年 (百万米ドル、AGR %)
図 233 オムロン社:R&D, 2019-2023 (百万米ドル, AGR%)
図 234 オムロン株式会社地域別市場シェア(%), 2023
図 235 Qualcomm Technologies, Inc:純収入、2017年~2023年(百万米ドル、AGR)
図 236 サムスン純収入, 2017-2023 (百万米ドル, AGR %)
図 237 シーメンス・ヘルスイニアス AG:純収入、2017~2023 年 (100 万米ドル、AGR %)
図238 シーメンス・ヘルスィニアースAG:R&D、2019-2023年(百万米ドル、AGR)
図 239 シーメンス・ヘルスィニアース AG:地域別市場シェア(%)、2023 年
図 240 Telefónica IoT & Big Data Tech, S.A.U:純収入, 2017-2023 (百万米ドル, AGR %)
ページTOPに戻る
Summary
Report Details
The Mobile and Digital Health Technologies Market Report 2024-2034: This report will prove invaluable to leading firms striving for new revenue pockets if they wish to better understand the industry and its underlying dynamics. It will be useful for companies that would like to expand into different industries or to expand their existing operations in a new region.
Increasing Penetration of Smartphones Worldwide Boosting Industry Growth
With smartphones becoming ubiquitous, their integration into healthcare systems has opened up a myriad of opportunities for improving access to medical information, facilitating communication between patients and healthcare providers, and empowering individuals to take charge of their health and wellness. One of the primary impacts of increasing smartphone penetration on healthcare is the proliferation of mobile health (mHealth) applications. These applications range from fitness trackers and symptom checkers to medication reminders and chronic disease management tools. They leverage the capabilities of smartphones, such as sensors, GPS, and connectivity, to collect, analyse, and disseminate health-related data in real-time. For users, these apps provide convenience, allowing them to monitor their health metrics, track progress towards fitness goals, and access personalised health recommendations at their fingertips. Smartphones have played a pivotal role in advancing telemedicine and remote patient monitoring solutions. Utilising video calls, messaging applications, and secure platforms, individuals can now conveniently consult healthcare professionals from afar, eliminating the necessity for in-person appointments. This is especially advantageous for those with limited mobility, residing in rural regions, or encountering obstacles in accessing traditional healthcare services. Furthermore, the widespread adoption of smartphones presents healthcare providers and organisations with opportunities to augment patient engagement and communication.
Mobile-responsive websites, patient portals, and secure messaging platforms enable seamless interaction between patients and providers, facilitating appointment scheduling, prescription refills, and access to medical records. As of 2024, approximately 4.88 billion individuals are estimated to possess smartphones, marking a rise of 635 million new smartphone users within just the last year (from 2023 to 2024). Stats show in 2019 there were 2.27 billion users, 2020;2.67 billion, 2021; 3.01 billion, 2022; 3.62 billion, 2023; 4.25 billion users worldwide.
Digital Health Technologies Emerging as a Promising Avenue for Addressing the Challenge of Rising Healthcare Costs
The escalating costs of healthcare have become a significant concern globally, prompting a search for innovative solutions to mitigate expenses while maintaining or even improving the quality of care. Digital health technologies have emerged as a promising avenue for addressing the challenge of rising healthcare costs. These technologies leverage digital platforms, data analytics, and communication tools to streamline processes, enhance efficiency, and optimise resource utilisation throughout the healthcare ecosystem.
One of the primary ways in which digital health technologies contribute to cost containment is through the optimisation of healthcare delivery processes. By digitising administrative tasks, such as appointment scheduling, billing, and medical record-keeping, healthcare providers can reduce overhead costs associated with paper-based systems and manual workflows. This proactive approach to healthcare management can help prevent expensive complications, lower hospital readmissions, and enable timely intervention when health issues arise, ultimately decreasing overall healthcare expenses. Additionally, telemedicine platforms facilitate virtual consultations between patients and healthcare providers, often eliminating the necessity for physical office visits.
This not only reduces transportation costs and time spent traveling to appointments but also enables providers to see more patients in a day, thereby optimising their time and increasing practice efficiency. Moreover, telemedicine can enhance access to specialised care for patients in underserved or rural areas, reducing disparities in healthcare delivery and potentially preventing costly complications associated with delayed or inadequate treatment.
What Questions Should You Ask before Buying a Market Research Report?
-
How is the mobile and digital health technologies market evolving?
-
What is driving and restraining the mobile and digital health technologies market?
-
How will each mobile and digital health technologies submarket segment grow over the forecast period and how much revenue will these submarkets account for in 2034?
-
How will the market shares for each mobile and digital health technologies submarket develop from 2024 to 2034?
-
What will be the main driver for the overall market from 2024 to 2034?
-
Will leading mobile and digital health technologies Markets broadly follow the macroeconomic dynamics, or will individual national markets outperform others?
-
How will the market shares of the national markets change by 2034 and which geographical region will lead the market in 2034?
-
Who are the leading players and what are their prospects over the forecast period?
-
What are the mobile and digital health technologies projects for these leading companies?
-
How will the industry evolve during the period between 2024 and 2034? What are the implications of mobile and digital health technologies projects taking place now and over the next 10 years?
-
Is there a greater need for product commercialisation to further scale the mobile and digital health technologies market?
-
Where is the mobile and digital health technologies market heading and how can you ensure you are at the forefront of the market?
-
What are the best investment options for new product and service lines?
-
What are the key prospects for moving companies into a new growth path and C-suite?
You need to discover how this will impact the Mobile and Digital Health Technologies Market today, and over the next 10 years:
-
Our 429-page report provides 179 tables and 240 charts/graphs exclusively to you.
-
The report highlights key lucrative areas in the industry so you can target them – NOW.
-
It contains in-depth analysis of global, regional and national sales and growth.
-
It highlights for you the key successful trends, changes and revenue projections made by your competitors.
This report tells you TODAY how the Mobile and Digital Health Technologies Market will develop in the next 10 years, and in line with the variations in COVID-19 economic recession and bounce. This market is more critical now than at any point over the last 10 years.
Forecasts to 2034 and other analyses reveal commercial prospects
-
In addition to revenue forecasting to 2034, our new study provides you with recent results, growth rates, and market shares.
-
You will find original analyses, with business outlooks and developments.
-
Discover qualitative analyses (including market dynamics, drivers, opportunities, restraints and challenges), cost structure, impact of rising Mobile and Digital Health Technologies prices and recent developments.
This report includes data analysis and invaluable insight into how COVID-19 will affect the industry and your company. Four COVID-19 recovery patterns and their impact, namely, “V”, “L”, “W” and “U” are discussed in this report.
Segments Covered in the Report
Technology
-
Tele-healthcare
– Telecare (Activity Monitoring, Remote Medication Management)
– Telehealth (LTC Monitoring, Video Consultation)
-
mHealth
– Wearables (BP Monitor, Glucose Meter, Pulse Oximeter, Sleep Apnea Monitors, Neurological Monitors, Others)
– Apps
-
Medical Apps
-
Fitness Apps
-
Digital Health Systems
– Electronic Health Records
– e-Prescribing Systems
-
Health Analytics
Component
-
Hardware
-
Software
-
Services
Application
-
Cardiology
-
Diabetes
-
Obesity
-
Neurology
-
Sleep Apnea
-
Others
End-users
-
Healthcare Providers
-
Healthcare Payers
-
Healthcare Consumers
-
Others
In addition to the revenue predictions for the overall world market and segments, you will also find revenue forecasts for four regional and 27 leading national markets:
North America
Europe
-
Germany
-
UK
-
France
-
Spain
-
Italy
-
Russia
-
Poland
-
Belgium
-
Rest of Europe
Asia Pacific
-
China
-
Japan
-
India
-
Australia
-
South Korea
-
Singapore
-
Taiwan
-
Rest of Asia Pacific
Latin America
-
Brazil
-
Mexico
-
Argentina
-
Colombia
-
Rest of Latin America
MEA
-
GCC
-
South Africa
-
Rest of MEA
The report also includes profiles and for some of the leading companies in the Mobile and Digital Health Technologies Market, 2024 to 2034, with a focus on this segment of these companies’ operations.
Leading companies profiled in the report
-
AdvancedMD
-
Allscripts Healthcare Solutions Inc.
-
Apple Inc.
-
Athenahealth, Inc.
-
AT & T
-
BioTelemetry Inc.
-
Oracle (Cerner Corporation)
-
Cisco Systems
-
eClinicalWorks
-
Epic Systems Corporation
-
GE HealthCare
-
IBM
-
iHealth Lab, Inc.
-
Koninklijke Philips N.V.
-
McKesson Corporation
-
Omron Corporation
-
Qualcomm Technologies, Inc.
-
Samsung
-
Siemens Healthineers AG
-
Telefónica IoT & Big Data Tech, S.A.U.
Overall world revenue for Mobile and Digital Health Technologies Market, 2024 to 2034 in terms of value the market will surpass US$250.8 billion in 2024, our work calculates. We predict strong revenue growth through to 2034. Our work identifies which organisations hold the greatest potential. Discover their capabilities, progress, and commercial prospects, helping you stay ahead.
How will the Mobile and Digital Health Technologies Market, 2024 to 2034 report help you?
In summary, our 420+ page report provides you with the following knowledge:
-
Revenue forecasts to 2034 for Mobile and Digital Health Technologies Market, 2024 to 2034 Market, with forecasts for material, design, type, delivery and application, each forecast at a global and regional level – discover the industry’s prospects, finding the most lucrative places for investments and revenues.
-
Revenue forecasts to 2034 for five regional and 26 key national markets – See forecasts for the Mobile and Digital Health Technologies Market, 2024 to 2034 market in North America, Europe, Asia-Pacific, Latin America, and MEA. Also forecasted is the market in the US, Canada, Mexico, Brazil, Germany, France, UK, Italy, China, India, Japan, and Australia among other prominent economies.
-
Prospects for established firms and those seeking to enter the market – including company profiles for 20 of the major companies involved in the Mobile and Digital Health Technologies Market, 2024 to 2034.
Find quantitative and qualitative analyses with independent predictions. Receive information that only our report contains, staying informed with invaluable business intelligence.
Information found nowhere else
With our new report, you are less likely to fall behind in knowledge or miss out on opportunities. See how our work could benefit your research, analyses, and decisions. Visiongain’s study is for everybody needing commercial analyses for the Mobile and Digital Health Technologies Market, 2024 to 2034, market-leading companies. You will find data, trends and predictions.
ページTOPに戻る
Table of Contents
1 Report Overview
1.1 Objectives of the Study
1.2 Introduction to Mobile and Digital Health Technologies
1.3 What This Report Delivers
1.4 Why You Should Read This Report
1.5 Key Questions Answered by This Analytical Report
1.6 Who is This Report for?
1.7 Methodology
1.7.1 Market Definitions
1.7.2 Market Evaluation & Forecasting Methodology
1.7.3 Data Validation
1.7.3.1 Primary Research
1.7.3.2 Secondary Research
1.8 Frequently Asked Questions (FAQs)
1.9 Associated Visiongain Reports
1.10 About Visiongain
2 Executive Summary
3 Market Overview
3.1 Key Findings
3.2 Market Dynamics
3.2.1 Market Driving Factors
3.2.1.1 Growing Adoption of Smartphones
3.2.1.2 Advancements in Smart Wearable Devices
3.2.1.3 Emergence of Telemedicine and Remote Patient Monitoring Systems
3.2.1.4 Favourable Government Initiatives and Regulations
3.2.1.5 Increasing Utilization of Connected Devices and Health Apps to Manage Chronic Diseases
3.2.1.6 Growing Penetration of 4G & 5G Networks to Ensure Uninterrupted Healthcare
3.2.1.7 Rising Focus on Patient-centric Healthcare Delivery
3.2.1.8 Increasing Demand for Home Healthcare Services
3.2.2 Market Restraining Factors
3.2.2.1 Privacy and Security Concerns
3.2.2.2 Lack of Interoperability
3.2.2.3 Absence of Established Standards and Regulations Coupled with Inadequate Reimbursement
3.2.2.4 Opposition from Conventional Healthcare Practitioners and Restricted Counsel from Physicians
3.2.3 Market Opportunities
3.2.3.1 Advancements in Artificial Intelligence (AI) and Machine Learning
3.2.3.2 Increasing Prevalence of Chronic Diseases
3.2.3.3 Advances in Genomics and Precision Medicine
3.2.3.4 Expansion Opportunities in Emerging Markets
3.3 COVID-19 Impact Analysis
3.4 Porter’s Five Forces Analysis
3.4.1 Bargaining Power of Suppliers
3.4.2 Bargaining Power of Buyers
3.4.3 Competitive Rivalry
3.4.4 Threat of Substitutes
3.4.5 Threat of New Entrants
3.5 PEST Analysis
4 Mobile and Digital Health Technologies Analysis by Technology
4.1 Key Findings
4.2 Technology Segment: Market Attractiveness Index
4.3 Mobile and Digital Health Technologies Size Estimation and Forecast by Technology
4.4 Tele-healthcare
4.4.1 Mobile and Digital Health Technologies Size Estimation and Forecast by Tele-healthcare
4.4.2 Market Size by Region, 2024-2034 (US$ Billion)
4.4.3 Telecare
4.4.3.1 Market Size by Telecare, 2024-2034 (US$ Billion)
4.4.3.2 Market Size by Region, 2024-2034 (US$ Billion)
4.4.3.3 Market Share by Region, 2024 & 2034 (%)
4.4.3.4 Market Size by Telehealth, 2024-2034 (US$ Billion)
4.4.3.5 Activity Monitoring
4.4.3.6 Remote Medication Management
4.4.4 Telehealth
4.4.4.1 Market Size by Region, 2024-2034 (US$ Billion)
4.4.4.2 Market Share by Region, 2024 & 2034 (%)
4.4.4.3 LTC Monitoring
4.4.4.4 Video Consultation
4.5 mHealth
4.5.1 Mobile and Digital Health Technologies Size Estimation and Forecast by mHealth
4.5.1.2 Wearables
4.5.1.3 Market Size by Wearables, 2024-2034 (US$ Billion)
4.5.1.4 BP Monitor
4.5.1.5 Glucose Meter
4.5.1.6 Pulse Oximeter
4.5.1.7 Sleep Apnea Monitors
4.5.1.8 Neurological Monitors
4.5.1.9 Others
4.5.1.10 Apps
4.5.1.11 Market Size by Type, 2024-2034 (US$ Billion)
4.6 Digital Health Systems
4.6.1 Mobile and Digital Health Technologies Size Estimation and Forecast by Digital Health Systems
4.6.1.1 Electronic Health Records
4.6.1.2 e-Prescribing Systems
4.7 Health Analytics
4.7.1 Market Size by Region, 2024-2034 (US$ Billion)
4.7.2 Market Share by Region, 2024 & 2034 (%)
5 Mobile and Digital Health Technologies Analysis by Component
5.1 Key Findings
5.2 Component Segment: Market Attractiveness Index
5.3 Mobile and Digital Health Technologies Size Estimation and Forecast by Component
5.4 Hardware
5.4.1 Market Size by Region, 2024-2034 (US$ Billion)
5.4.2 Market Share by Region, 2024 & 2034 (%)
5.5 Software
5.5.1 Market Size by Region, 2024-2034 (US$ Billion)
5.5.2 Market Share by Region, 2024 & 2034 (%)
5.6 Services
5.6.1 Market Size by Region, 2024-2034 (US$ Billion)
5.6.2 Market Share by Region, 2024 & 2034 (%)
6 Mobile and Digital Health Technologies Analysis by Application
6.1 Key Findings
6.2 Application Segment: Market Attractiveness Index
6.3 Mobile and Digital Health Technologies Size Estimation and Forecast by Application
6.4 Cardiology
6.4.1 Market Size by Region, 2024-2034 (US$ Billion)
6.4.2 Market Share by Region, 2024 & 2034 (%)
6.5 Diabetes
6.5.1 Market Size by Region, 2024-2034 (US$ Billion)
6.5.2 Market Share by Region, 2024 & 2034 (%)
6.6 Obesity
6.6.1 Market Size by Region, 2024-2034 (US$ Billion)
6.6.2 Market Share by Region, 2024 & 2034 (%)
6.7 Neurology
6.7.1 Market Size by Region, 2024-2034 (US$ Billion)
6.7.2 Market Share by Region, 2024 & 2034 (%)
6.8 Sleep Apnea
6.8.1 Market Size by Region, 2024-2034 (US$ Billion)
6.8.2 Market Share by Region, 2024 & 2034 (%)
6.9 Others
6.9.1 Market Size by Region, 2024-2034 (US$ Billion)
6.9.2 Market Share by Region, 2024 & 2034 (%)
7 Mobile and Digital Health Technologies Analysis by End-users
7.1 Key Findings
7.2 End-users Segment: Market Attractiveness Index
7.3 Mobile and Digital Health Technologies Size Estimation and Forecast by End-users
7.4 Healthcare Providers
7.4.1 Market Size by Region, 2024-2034 (US$ Billion)
7.4.2 Market Share by Region, 2024 & 2034 (%)
7.5 Healthcare Payers
7.5.1 Market Size by Region, 2024-2034 (US$ Billion)
7.5.2 Market Share by Region, 2024 & 2034 (%)
7.6 Healthcare Consumers
7.6.1 Market Size by Region, 2024-2034 (US$ Billion)
7.6.2 Market Share by Region, 2024 & 2034 (%)
7.7 Others
7.7.1 Market Size by Region, 2024-2034 (US$ Billion)
7.7.2 Market Share by Region, 2024 & 2034 (%)
8 Mobile and Digital Health Technologies Analysis by Region
8.1 Key Findings
8.2 Regional Market Size Estimation and Forecast
9 North America Mobile and Digital Health Technologies Analysis
9.1 Key Findings
9.2 North America Mobile and Digital Health Technologies Attractiveness Index
9.3 North America Mobile and Digital Health Technologies by Country, 2024, 2029 & 2034 (US$ Billion)
9.4 North America Mobile and Digital Health Technologies Size Estimation and Forecast by Country
9.5 North America Mobile and Digital Health Technologies Size Estimation and Forecast by Technology
9.5.1 North America Mobile and Digital Health Technologies Forecast by Tele-healthcare
9.5.2 North America Mobile and Digital Health Technologies Forecast by mHealth
9.5.3 North America Mobile and Digital Health Technologies Forecast by Digital Health System
9.6 North America Mobile and Digital Health Technologies Size Estimation and Forecast by Component
9.7 North America Mobile and Digital Health Technologies Size Estimation and Forecast by Application
9.8 North America Mobile and Digital Health Technologies Size Estimation and Forecast by End-users
9.9 U.S. Mobile and Digital Health Technologies Analysis
9.10 Canada Mobile and Digital Health Technologies Analysis
10 Europe Mobile and Digital Health Technologies Analysis
10.1 Key Findings
10.2 Europe Mobile and Digital Health Technologies Attractiveness Index
10.3 Europe Mobile and Digital Health Technologies by Country, 2024, 2029 & 2034 (US$ Billion)
10.4 Europe Mobile and Digital Health Technologies Size Estimation and Forecast by Country
10.5 Europe Mobile and Digital Health Technologies Size Estimation and Forecast by Technology
10.5.1 Europe Mobile and Digital Health Technologies Forecast by Tele-healthcare
10.5.2 Europe Mobile and Digital Health Technologies Forecast by mHealth
10.5.3 Europe Mobile and Digital Health Technologies Forecast by Digital Health System
10.6 Europe Mobile and Digital Health Technologies Size Estimation and Forecast by Component
10.7 Europe Mobile and Digital Health Technologies Size Estimation and Forecast by Application
10.8 Europe Mobile and Digital Health Technologies Size Estimation and Forecast by End-users
10.9 Germany Mobile and Digital Health Technologies Analysis
10.10 France Mobile and Digital Health Technologies Analysis
10.11 UK Mobile and Digital Health Technologies Analysis
10.12 Italy Mobile and Digital Health Technologies Analysis
10.13 Spain Mobile and Digital Health Technologies Analysis
10.14 Russia Mobile and Digital Health Technologies Analysis
10.15 Poland Mobile and Digital Health Technologies Analysis
10.16 Belgium Mobile and Digital Health Technologies Analysis
10.17 Rest of Europe Mobile and Digital Health Technologies Analysis
11 Asia Pacific Mobile and Digital Health Technologies Analysis
11.1 Key Findings
11.2 Asia Pacific Mobile and Digital Health Technologies Attractiveness Index
11.3 Asia Pacific Mobile and Digital Health Technologies by Country, 2024, 2029 & 2034 (US$ Billion)
11.4 Asia Pacific Mobile and Digital Health Technologies Size Estimation and Forecast by Country
11.5 Asia Pacific Mobile and Digital Health Technologies Size Estimation and Forecast by Technology
11.5.1 Asia Pacific Mobile and Digital Health Technologies Market Size Estimation and Forecast by Tele-healthcare
11.5.2 Asia Pacific Mobile and Digital Health Technologies Market Forecast by mHealth
11.5.3 Asia Pacific Mobile and Digital Health Technologies Market Forecast by Digital Health Systems
11.6 Asia Pacific Mobile and Digital Health Technologies Size Estimation and Forecast by Component
11.7 Asia Pacific Mobile and Digital Health Technologies Size Estimation and Forecast by Application
11.8 Asia Pacific Mobile and Digital Health Technologies Size Estimation and Forecast by End-users
11.9 Japan Mobile and Digital Health Technologies Analysis
11.10 China Mobile and Digital Health Technologies Analysis
11.11 India Mobile and Digital Health Technologies Analysis
11.12 Australia Mobile and Digital Health Technologies Analysis
11.13 South Korea Mobile and Digital Health Technologies Analysis
11.14 Singapore Mobile and Digital Health Technologies Analysis
11.15 Taiwan Mobile and Digital Health Technologies Analysis
11.16 Rest of Asia Pacific Mobile and Digital Health Technologies Analysis
12 Latin America Mobile and Digital Health Technologies Analysis
12.1 Key Findings
12.2 Latin America Mobile and Digital Health Technologies Attractiveness Index
12.3 Latin America Mobile and Digital Health Technologies by Country, 2024, 2029 & 2034 (US$ Billion)
12.4 Latin America Mobile and Digital Health Technologies Size Estimation and Forecast by Country
12.5 Latin America Mobile and Digital Health Technologies Size Estimation and Forecast by Technology
12.5.1 Latin America Mobile and Digital Health Technologies Size Estimation and Forecast by Tele-healthcare
12.5.2 Latin America mHealth Size Estimation and Forecast by Technology
12.5.3 Latin America Mobile and Digital Health Technologies Forecast by Digital Health Systems
12.6 Latin America Mobile and Digital Health Technologies Size Estimation and Forecast by Component
12.7 Latin America Mobile and Digital Health Technologies Size Estimation and Forecast by Application
12.8 Latin America Mobile and Digital Health Technologies Size Estimation and Forecast by End-users
12.9 Brazil Mobile and Digital Health Technologies Analysis
12.10 Mexico Mobile and Digital Health Technologies Analysis
12.11 Argentina Mobile and Digital Health Technologies Analysis
12.12 Colombia Mobile and Digital Health Technologies Analysis
12.13 Rest of Latin America Mobile and Digital Health Technologies Analysis
13 MEA Mobile and Digital Health Technologies Analysis
13.1 Key Findings
13.2 MEA Mobile and Digital Health Technologies Attractiveness Index
13.3 MEA Mobile and Digital Health Technologies by Country, 2024, 2029 & 2034 (US$ Billion)
13.4 MEA Mobile and Digital Health Technologies Size Estimation and Forecast by Country
13.5 MEA Mobile and Digital Health Technologies Size Estimation and Forecast by Technology
13.5.1 MEA Mobile and Digital Health Technologies Size Estimation and Forecast by Tele-healthcare
13.5.2 MEA Mobile and Digital Health Technologies Size Estimation and Forecast by mHealth
13.5.3 MEA Mobile and Digital Health Technologies Size Estimation and Forecast by Digital Health Technologies
13.6 MEA Mobile and Digital Health Technologies Size Estimation and Forecast by Component
13.7 MEA Mobile and Digital Health Technologies Size Estimation and Forecast by Application
13.8 MEA Mobile and Digital Health Technologies Size Estimation and Forecast by End-users
13.9 GCC Mobile and Digital Health Technologies Analysis
13.10 South Africa Mobile and Digital Health Technologies Analysis
13.11 Rest of MEA Mobile and Digital Health Technologies Analysis
14 Company Profiles
14.1 Competitive Landscape, 2023
14.2 Strategic Outlook
14.3 AdvancedMD, Inc.
14.3.1 Company Snapshot
14.3.2 Company Overview
14.3.3 Product Benchmarking
14.3.4 Strategic Outlook
14.4 Allscripts Healthcare Solutions Inc. (Veradigm LLC)
14.4.1 Company Snapshot
14.4.2 Company Overview
14.4.3 Financial Analysis
14.4.3.1 Net Revenue, 2017-2022
14.4.3.2 R&D, 2017-2021
14.4.3.3 Regional Market Shares, 2022
14.4.4 Product Benchmarking
14.4.5 Strategic Outlook
14.5 Apple Inc.
14.5.1 Company Snapshot
14.5.2 Company Overview
14.5.3 Financial Analysis
14.5.3.1 Net Revenue, 2017-2023
14.5.3.2 R&D, 2017-2023
14.5.3.3 Regional Market Shares, 2023
14.5.4 Product Benchmarking
14.5.5 Strategic Outlook
14.6 Athenahealth, Inc.
14.6.1 Company Snapshot
14.6.2 Company Overview
14.6.3 Product Benchmarking
14.6.4 Strategic Outlook
14.7 AT&T
14.7.1 Company Snapshot
14.7.2 Company Overview
14.7.3 Financial Analysis
14.7.3.1 Net Revenue, 2017-2023
14.7.3.2 Regional Market Shares, 2023
14.7.4 Product Benchmarking
14.7.5 Strategic Outlook
14.8 BioTelemetry Inc.
14.8.1 Company Snapshot
14.8.2 Company Overview
14.8.3 Financial Analysis
14.8.3.1 Net Revenue, 2017-2019
14.8.3.2 R&D, 2017-2019
14.8.4 Product Benchmarking
14.8.5 Strategic Outlook
14.9 Oracle (Cerner Corporation)
14.9.1 Company Snapshot
14.9.2 Company Overview
14.9.3 Financial Analysis
14.9.3.1 Net Revenue, 2017-2023
14.9.3.2 R&D, 2017-2023
14.9.3.3 Regional Market Shares, 2023
14.9.4 Product Benchmarking
14.9.5 Strategic Outlook
14.10 Cisco Systems, Inc.
14.10.1 Company Snapshot
14.10.2 Company Overview
14.10.3 Financial Analysis
14.10.3.1 Net Revenue, 2017-2023
14.10.3.2 R&D, 2017-2023
14.10.3.3 Regional Market Shares, 2023
14.10.4 Product Benchmarking
14.10.5 Strategic Outlook
14.11 eClinicalWorks
14.11.1 Company Snapshot
14.11.2 Company Overview
14.11.3 Product Benchmarking
14.11.4 Strategic Outlook
14.12 Epic Systems Corporation.
14.12.1 Company Snapshot
14.12.2 Company Overview
14.12.3 Product Benchmarking
14.12.4 Strategic Outlook
14.13 GE HealthCare.
14.13.1 Company Snapshot
14.13.2 Company Overview
14.13.3 Financial Analysis
14.13.3.1 Net Revenue, 2017-2023
14.13.3.2 R&D, 2017-2023
14.13.4 Product Benchmarking
14.13.5 Strategic Outlook
14.14 IBM
14.14.1 Company Snapshot
14.14.2 Company Overview
14.14.3 Financial Analysis
14.14.3.1 Net Revenue, 2017-2023
14.14.3.2 R&D, 2017-2023
14.14.3.3 Regional Market Shares, 2023
14.14.4 Product Benchmarking
14.14.5 Strategic Outlook
14.15 IHealth Lab, Inc.
14.15.1 Company Snapshot
14.15.2 Company Overview
14.15.3 Product Benchmarking
14.15.4 Strategic Outlook
14.16 Koninklijke Philips N.V
14.16.1 Company Snapshot
14.16.2 Company Overview
14.16.3 Financial Analysis
14.16.3.1 Net Revenue, 2017-2023
14.16.3.2 R&D, 2017-2023
14.16.3.3 Regional Market Shares, 2023
14.16.4 Product Benchmarking
14.16.5 Strategic Outlook
14.17 McKesson Corporation
14.17.1 Company Snapshot
14.17.2 Company Overview
14.17.3 Financial Analysis
14.17.3.1 Net Revenue, 2017-2023
14.17.3.2 Regional Market Shares, 2023
14.17.4 Product Benchmarking
14.17.5 Strategic Outlook
14.18 Omron Corporation
14.18.1 Company Snapshot
14.18.2 Company Overview
14.18.3 Financial Analysis
14.18.3.1 Net Revenue, 2017-2023
14.18.3.2 R&D, 2019-2023
14.18.3.3 Regional Market Shares, 2023
14.18.4 Product Benchmarking
14.18.5 Strategic Outlook
14.19 Qualcomm Technologies, Inc.
14.19.1 Company Snapshot
14.19.2 Company Overview
14.19.3 Financial Analysis
14.19.3.1 Net Revenue, 2017-2023
14.19.4 Product Benchmarking
14.19.5 Strategic Outlook
14.20 Samsung
14.20.1 Company Snapshot
14.20.2 Company Overview
14.20.3 Financial Analysis
14.20.3.1 Net Revenue, 2017-2023
14.20.4 Product Benchmarking
14.20.5 Strategic Outlook
14.21 Siemens Healthineers AG
14.21.1 Company Snapshot
14.21.2 Company Overview
14.21.3 Financial Analysis
14.21.3.1 Net Revenue, 2017-2023
14.21.3.2 R&D, 2019-2023
14.21.3.3 Regional Market Shares, 2023
14.21.4 Product Benchmarking
14.21.5 Strategic Outlook
14.22 Telefónica IoT & Big Data Tech, S.A.U.
14.22.1 Company Snapshot
14.22.2 Company Overview
14.22.3 Financial Analysis
14.22.3.1 Net Revenue, 2017-2023
14.22.4 Product Benchmarking
14.22.5 Strategic Outlook
15 Conclusion and Recommendations
15.1 Concluding Remarks from Visiongain
15.2 Recommendations for Market Players
ページTOPに戻る
List of Tables/Graphs
List of Tables
Table 1 Mobile and Digital Health Technologies Snapshot, 2024 & 2034 (US$ Billion, CAGR %)
Table 2 Mobile and Digital Health Technologies Forecast by Region, 2024-2034 (US$ Billion, AGR%, CAGR%): “V” Shaped Recovery
Table 3 Mobile and Digital Health Technologies Forecast by Region, 2024-2034 (US$ Billion, AGR%, CAGR%): “U” Shaped Recovery
Table 4 Mobile and Digital Health Technologies Forecast by Region, 2024-2034 (US$ Billion, AGR%, CAGR%): “W” Shaped Recovery
Table 5 Mobile and Digital Health Technologies Forecast by Region, 2024-2034 (US$ Billion, AGR%, CAGR%): “L” Shaped Recovery
Table 6 Mobile and Digital Health Technologies Forecast by Technology, 2024-2034 (US$ Billion, AGR%, CAGR %)
Table 7 Mobile and Digital Health Technologies Forecast by Tele-healthcare, 2024-2034 (US$ Billion, AGR%, CAGR %)
Table 8 Tele-healthcare Segment Market Forecast by Region, 2024-2034 (US$ Billion, AGR%, CAGR%)
Table 9 Mobile and Digital Health Technologies Market Forecast by Telecare, 2024-2034 (US$ Billion, AGR%, CAGR%)
Table 10 Mobile and Digital Health Technologies Market Forecast by Region, 2024-2034 (US$ Billion, AGR%, CAGR%)
Table 11 Mobile and Digital Health Technologies Market Forecast by Telehealth, 2024-2034 (US$ Billion, AGR%, CAGR%)
Table 12 Activity Monitoring Segment Market Forecast by Region, 2024-2034 (US$ Billion, AGR%, CAGR %)
Table 13 Remote Medication Management Segment Market Forecast by Region, 2024-2034 (US$ Billion, AGR%, CAGR %)
Table 14 Telehealth Segment Market Forecast by Region, 2024-2034 (US$ Billion, AGR%, CAGR %)
Table 15 LTC Monitoring Segment Market Forecast by Region, 2024-2034 (US$ Billion, AGR%, CAGR %)
Table 16 Video Consultation Segment Market Forecast by Region, 2024-2034 (US$ Billion, AGR%, CAGR %)
Table 17 Mobile and Digital Health Technologies Forecast by mHealth, 2024-2034 (US$ Billion, AGR%, CAGR %)
Table 18 mHealth Segment Market Forecast by Region, 2024-2034 (US$ Billion, AGR%, CAGR%)
Table 19 Mobile and Digital Health Technologies Market Forecast by Wearables, 2024-2034 (US$ Billion, AGR%, CAGR%)
Table 20 Wearables Segment Market Forecast by Region, 2024-2034 (US$ Billion, AGR%, CAGR%)
Table 21 BP Monitor Segment Market Forecast by Region, 2024-2034 (US$ Billion, AGR%, CAGR %)
Table 22 Glucose Meter Segment Market Forecast by Region, 2024-2034 (US$ Billion, AGR%, CAGR %)
Table 23 Pulse Oximeter Segment Market Forecast by Region, 2024-2034 (US$ Billion, AGR%, CAGR %)
Table 24 Sleep Apnea Monitors Segment Market Forecast by Region, 2024-2034 (US$ Billion, AGR%, CAGR %)
Table 25 Neurological Monitors Segment Market Forecast by Region, 2024-2034 (US$ Billion, AGR%, CAGR %)
Table 26 Others Segment Market Forecast by Region, 2024-2034 (US$ Billion, AGR%, CAGR %)
Table 27 Mobile and Digital Health Technologies Market Forecast by Apps, 2024-2034 (US$ Billion, AGR%, CAGR%)
Table 28 Apps Segment Market Forecast by Region, 2024-2034 (US$ Billion, AGR%, CAGR %)
Table 29 Medical Apps Segment Market Forecast by Region, 2024-2034 (US$ Billion, AGR%, CAGR %)
Table 30 Fitness Apps Segment Market Forecast by Region, 2024-2034 (US$ Billion, AGR%, CAGR %)
Table 31 Mobile and Digital Health Technologies Forecast by Digital Health Systems, 2024-2034 (US$ Billion, AGR%, CAGR %)
Table 32 Electronic Health Records Segment Market Forecast by Region, 2024-2034 (US$ Billion, AGR%, CAGR%)
Table 33 E-Prescribing Systems Segment Market Forecast by Region, 2024-2034 (US$ Billion, AGR%, CAGR %)
Table 34 Health Analytics Segment Market Forecast by Region, 2024-2034 (US$ Billion, AGR%, CAGR%)
Table 35 Mobile and Digital Health Technologies Component, 2024-2034 (US$ Billion, AGR%, CAGR %)
Table 36 Hardware Market Forecast by Region, 2024-2034 (US$ Billion, AGR%, CAGR %)
Table 37 Software Market Forecast by Region, 2024-2034 (US$ Billion, AGR%, CAGR %)
Table 38 Services Market Forecast by Region, 2024-2034 (US$ Billion, AGR%, CAGR %)
Table 39 Mobile and Digital Health Technologies by Application 2024-2034 (US$ Billion, AGR%, CAGR%)
Table 40 Cardiology Market Forecast by Region, 2024-2034 (US$ Billion, AGR%, CAGR%)
Table 41 Diabetes Market Forecast by Region, 2024-2034 (US$ Billion, AGR%, CAGR %)
Table 42 Obesity Market Forecast by Region, 2024-2034 (US$ Billion, AGR%, CAGR%)
Table 43 Neurology Market Forecast by Region, 2024-2034 (US$ Billion, AGR%, CAGR%)
Table 44 Sleep Apnea Market Forecast by Region, 2024-2034 (US$ Billion, AGR%, CAGR%)
Table 45 Others Market Forecast by Region, 2024-2034 (US$ Billion, AGR%, CAGR%)
Table 46 Mobile and Digital Health Technologies End-users, 2024-2034 (US$ Billion, AGR%, CAGR%)
Table 47 Healthcare Providers Market Forecast by Region, 2024-2034 (US$ Billion, AGR%, CAGR%)
Table 48 Healthcare Payers Market Forecast by Region, 2024-2034 (US$ Billion, AGR%, CAGR %)
Table 49 Healthcare Consumers Market Forecast by Region, 2024-2034 (US$ Billion, AGR%, CAGR%)
Table 50 Others Market Forecast by Region, 2024-2034 (US$ Billion, AGR%, CAGR%)
Table 51 Mobile and Digital Health Technologies Forecast by Region, 2024-2034 (US$ Billion, AGR%, CAGR %)
Table 52 North America Mobile and Digital Health Technologies Forecast by Country, 2024-2034 (US$ Billion, AGR%, CAGR %)
Table 53 North America Mobile and Digital Health Technologies Forecast by Technology, 2024-2034 (US$ Billion, AGR%, CAGR %)
Table 54 North America Mobile and Digital Health Technologies Forecast by Tele-healthcare, 2024-2034 (US$ Billion, AGR%, CAGR %)
Table 55 North America Mobile and Digital Health Technologies Forecast by mHealth, 2024-2034 (US$ Billion, AGR%, CAGR %)
Table 56 North America Mobile and Digital Health Technologies Forecast by Digital Health System, 2024-2034 (US$ Billion, AGR%, CAGR %)
Table 57 North America Mobile and Digital Health Technologies Component, 2024-2034 (US$ Billion, AGR%, CAGR %)
Table 58 North America Mobile and Digital Health Technologies by Application 2024-2034 (US$ Billion, AGR%, CAGR%)
Table 59 North America Mobile and Digital Health Technologies End-users, 2024-2034 (US$ Billion, AGR%, CAGR%)
Table 60 U.S. Mobile and Digital Health Technologies Forecast, 2024-2034 (US$ Billion, AGR%, CAGR%)
Table 61 Canada Mobile and Digital Health Technologies Forecast, 2024-2034 (US$ Billion, AGR%, CAGR %)
Table 62 Europe Mobile and Digital Health Technologies Forecast by Country, 2024-2034 (US$ Billion, AGR%, CAGR%)
Table 63 Europe Mobile and Digital Health Technologies Forecast by Technology, 2024-2034 (US$ Billion, AGR%, CAGR %)
Table 64 Europe Mobile and Digital Health Technologies Market Forecast by Telehealthcare, 2024-2034 (US$ Billion, AGR%, CAGR %)
Table 65 Europe Mobile and Digital Health Technologies Market Forecast by mHealth, 2024-2034 (US$ Billion, AGR%, CAGR %)
Table 66 Europe Mobile and Digital Health Technologies Market by Digital Health Systems, 2024-2034 (US$ Billion, AGR%, CAGR %)
Table 67 Europe Mobile and Digital Health Technologies Component, 2024-2034 (US$ Billion, AGR%, CAGR %)
Table 68 Europe Mobile and Digital Health Technologies by Application 2024-2034 (US$ Billion, AGR%, CAGR%)
Table 69 Europe Mobile and Digital Health Technologies End-users, 2024-2034 (US$ Billion, AGR%, CAGR%)
Table 70 Germany Mobile and Digital Health Technologies Forecast, 2024-2034 (US$ Billion, AGR%, CAGR %)
Table 71 France Mobile and Digital Health Technologies Forecast, 2024-2034 (US$ Billion, AGR%, CAGR %)
Table 72 UK Mobile and Digital Health Technologies Forecast, 2024-2034 (US$ Billion, AGR%, CAGR%)
Table 73 Italy Mobile and Digital Health Technologies Forecast, 2024-2034 (US$ Billion, AGR%, CAGR %)
Table 74 Spain Mobile and Digital Health Technologies Forecast, 2024-2034 (US$ Billion, AGR%, CAGR %)
Table 75 Russia Mobile and Digital Health Technologies Forecast, 2024-2034 (US$ Billion, AGR%, CAGR%)
Table 76 Poland Mobile and Digital Health Technologies Forecast, 2024-2034 (US$ Billion, AGR%, CAGR%)
Table 77 Belgium Mobile and Digital Health Technologies Forecast, 2024-2034 (US$ Billion, AGR%, CAGR%)
Table 78 Rest of Europe Mobile and Digital Health Technologies Forecast, 2024-2034 (US$ Billion, AGR%, CAGR%)
Table 79 Asia Pacific Mobile and Digital Health Technologies Forecast by Country, 2024-2034 (US$ Billion, AGR%, CAGR%)
Table 80 Asia Pacific Mobile and Digital Health Technologies Forecast by Technology, 2024-2034 (US$ Billion, AGR%, CAGR %)
Table 81 Asia Pacific Mobile and Digital Health Technologies Market by Tele-healthcare, 2024-2034 (US$ Billion, AGR%, CAGR %)
Table 82 Asia Pacific Mobile and Digital Health Technologies Market Forecast by mHealth, 2024-2034 (US$ Billion, AGR%, CAGR %)
Table 83 Asia Pacific Mobile and Digital Health Technologies Market Forecast by Digital Health Systems, 2024-2034 (US$ Billion, AGR%, CAGR %)
Table 84 Asia Pacific Mobile and Digital Health Technologies Component, 2024-2034 (US$ Billion, AGR%, CAGR %)
Table 85 Asia Pacific Mobile and Digital Health Technologies by Application 2024-2034 (US$ Billion, AGR%, CAGR%)
Table 86 Asia Pacific Mobile and Digital Health Technologies End-users, 2024-2034 (US$ Billion, AGR%, CAGR%)
Table 87 Japan Mobile and Digital Health Technologies Forecast, 2024-2034 (US$ Billion, AGR%, CAGR%)
Table 88 China Mobile and Digital Health Technologies Forecast, 2024-2034 (US$ Billion, AGR%, CAGR%)
Table 89 India Mobile and Digital Health Technologies Forecast, 2024-2034 (US$ Billion, AGR%, CAGR %)
Table 90 Australia Mobile and Digital Health Technologies Forecast, 2024-2034 (US$ Billion, AGR%, CAGR %)
Table 91 South Korea Mobile and Digital Health Technologies Forecast, 2024-2034 (US$ Billion, AGR%, CAGR%)
Table 92 Singapore Mobile and Digital Health Technologies Forecast, 2024-2034 (US$ Billion, AGR%, CAGR %)
Table 93 Taiwan Mobile and Digital Health Technologies Forecast, 2024-2034 (US$ Billion, AGR%, CAGR%)
Table 94 Rest of Asia Pacific Mobile and Digital Health Technologies Forecast, 2024-2034 (US$ Billion, AGR%, CAGR %)
Table 95 Latin America Mobile and Digital Health Technologies Forecast by Country, 2024-2034 (US$ Billion, AGR%, CAGR%)
Table 96 Latin America Mobile and Digital Health Technologies Forecast by Technology, 2024-2034 (US$ Billion, AGR%, CAGR %)
Table 97 Latin America Mobile and Digital Health Technologies Forecast by Tele-healthcare, 2024-2034 (US$ Billion, AGR%, CAGR %)
Table 98 Latin America Mobile and Digital Health Technologies Forecast by mHealth, 2024-2034 (US$ Billion, AGR%, CAGR %)
Table 99 Latin America Mobile and Digital Health Technologies Forecast by Digital Health Systems, 2024-2034 (US$ Billion, AGR%, CAGR %)
Table 100 Latin America Mobile and Digital Health Technologies Component, 2024-2034 (US$ Billion, AGR%, CAGR %)
Table 101 Latin America Mobile and Digital Health Technologies by Application 2024-2034 (US$ Billion, AGR%, CAGR%)
Table 102 Latin America Mobile and Digital Health Technologies End-users, 2024-2034 (US$ Billion, AGR%, CAGR%)
Table 103 Brazil Mobile and Digital Health Technologies Forecast, 2024-2034 (US$ Billion, AGR%, CAGR %)
Table 104 Mexico Mobile and Digital Health Technologies Forecast, 2024-2034 (US$ Billion, AGR%, CAGR%)
Table 105 Argentina Mobile and Digital Health Technologies Forecast, 2024-2034 (US$ Billion, AGR%, CAGR%)
Table 106 Colombia Mobile and Digital Health Technologies Forecast, 2024-2034 (US$ Billion, AGR%, CAGR%)
Table 107 Rest of Latin America Mobile and Digital Health Technologies Forecast, 2024-2034 (US$ Billion, AGR%, CAGR%)
Table 108 MEA Mobile and Digital Health Technologies Forecast by Country, 2024-2034 (US$ Billion, AGR%, CAGR%)
Table 109 MEA Mobile and Digital Health Technologies Forecast by Technology, 2024-2034 (US$ Billion, AGR%, CAGR %)
Table 110 MEA Mobile and Digital Health Technologies Size Estimation and Forecast by Tele-healthcare, 2024-2034 (US$ Billion, AGR%, CAGR %)
Table 111 MEA Mobile and Digital Health Technologies Size Estimation and Forecast by mHealth, 2024-2034 (US$ Billion, AGR%, CAGR %)
Table 112 MEA Mobile and Digital Health Technologies Forecast by Digital Health Systems, 2024-2034 (US$ Billion, AGR%, CAGR %)
Table 113 MEA Mobile and Digital Health Technologies Component, 2024-2034 (US$ Billion, AGR%, CAGR %)
Table 114 MEA Mobile and Digital Health Technologies by Application 2024-2034 (US$ Billion, AGR%, CAGR%)
Table 115 MEA Mobile and Digital Health Technologies End-users, 2024-2034 (US$ Billion, AGR%, CAGR%)
Table 116 GCC Mobile and Digital Health Technologies Forecast, 2024-2034 (US$ Billion, AGR%, CAGR%)
Table 117 South Africa Mobile and Digital Health Technologies Forecast, 2024-2034 (US$ Billion, AGR%, CAGR%)
Table 118 Rest of MEA Mobile and Digital Health Technologies Forecast, 2024-2034 (US$ Billion, AGR%, CAGR %)
Table 119 Strategic Outlook
Table 120 AdvancedMD, Inc.: Key Details, (CEO, HQ, Revenue, Founded, No. of Employees, Company Type, Website, Business Segment)
Table 121 AdvancedMD, Inc.: Product Benchmarking
Table 122 AdvancedMD, Inc.: Strategic Outlook
Table 123 Allscripts Healthcare Solutions Inc. (Veradigm LLC): Key Details, (CEO, HQ, Revenue, Founded, No. of Employees, Company Type, Website, Business Segment)
Table 124 Allscripts Healthcare Solutions Inc. (Veradigm LLC): Product Benchmarking
Table 125 Allscripts Healthcare Solutions Inc. (Veradigm LLC): Strategic Outlook
Table 126 Apple Inc.: Key Details, (CEO, HQ, Revenue, Founded, No. of Employees, Company Type, Website, Business Segment)
Table 127 Apple Inc.: Product Benchmarking
Table 128 Apple Inc.: Strategic Outlook
Table 129 Athenahealth, Inc.: Key Details, (CEO, HQ, Revenue, Founded, No. of Employees, Company Type, Website, Business Segment)
Table 130 Athenahealth, Inc.: Product Benchmarking
Table 131 Athenahealth, Inc.: Strategic Outlook
Table 132 AT&T: Key Details, (CEO, HQ, Revenue, Founded, No. of Employees, Company Type, Website, Business Segment)
Table 133 AT&T: Product Benchmarking
Table 134 AT&T: Strategic Outlook
Table 135 BioTelemetry Inc: Key Details, (CEO, HQ, Revenue, Founded, No. of Employees, Company Type, Website, Business Segment)
Table 136 BioTelemetry Inc: Product Benchmarking
Table 137 BioTelemetry Inc: Strategic Outlook
Table 138 Oracle (Cerner Corporation); Key Details, (CEO, HQ, Revenue, Founded, No. of Employees, Company Type, Website, Business Segment)
Table 139 Oracle (Cerner Corporation): Product Benchmarking
Table 140 Oracle (Cerner Corporation): Strategic Outlook
Table 141 Cisco Systems, Inc. ;Key Details, (CEO, HQ, Revenue, Founded, No. of Employees, Company Type, Website, Business Segment)
Table 142 Cisco Systems, Inc., Product Benchmarking
Table 143 Cisco Systems, Inc. ; Strategic Outlook
Table 144 EClinicalWorks.: Key Details, (CEO, HQ, Revenue, Founded, No. of Employees, Company Type, Website, Business Segment)
Table 145 EClinicalWorks.: Product Benchmarking
Table 146 EClinicalWorks.: Strategic Outlook
Table 147 Epic Systems Corporation.: Key Details, (CEO, HQ, Revenue, Founded, No. of Employees, Company Type, Website, Business Segment)
Table 148 Epic Systems Corporation.: Product Benchmarking
Table 149 Epic Systems Corporation.: Strategic Outlook
Table 150 GE HealthCare.; Key Details, (CEO, HQ, Revenue, Founded, No. of Employees, Company Type, Website, Business Segment)
Table 151 GE HealthCare.: Product Benchmarking
Table 152 GE HealthCare.; Strategic Outlook
Table 153 IBM ; Key Details, (CEO, HQ, Revenue, Founded, No. of Employees, Company Type, Website, Business Segment)
Table 154 IBM: Product Benchmarking
Table 155 IBM; Strategic Outlook
Table 156 IHealth Lab, Inc.: Key Details, (CEO, HQ, Revenue, Founded, No. of Employees, Company Type, Website, Business Segment)
Table 157 IHealth Lab, Inc.: Product Benchmarking
Table 158 IHealth Lab, Inc.: Strategic Outlook
Table 159 Koninklijke Philips N.V: Key Details, (CEO, HQ, Revenue, Founded, No. of Employees, Company Type, Website, Business Segment)
Table 160 Koninklijke Philips N.V.: Product Benchmarking
Table 161 Koninklijke Philips N.V.: Strategic Outlook
Table 162 McKesson Corporation: Key Details, (CEO, HQ, Revenue, Founded, No. of Employees, Company Type, Website, Business Segment)
Table 163 McKesson Corporation: Product Benchmarking
Table 164 McKesson Corporation: Strategic Outlook
Table 165 Omron Corporation: Key Details, (CEO, HQ, Revenue, Founded, No. of Employees, Company Type, Website, Business Segment)
Table 166 Omron Corporation: Product Benchmarking
Table 167 Omron Corporation: Strategic Outlook
Table 168 Qualcomm Technologies, Inc.: Key Details, (CEO, HQ, Revenue, Founded, No. of Employees, Company Type, Website, Business Segment)
Table 169 Qualcomm Technologies, Inc.: Product Benchmarking
Table 170 Qualcomm Technologies, Inc.: Strategic Outlook
Table 171 Samsung: Key Details, (CEO, HQ, Revenue, Founded, No. of Employees, Company Type, Website, Business Segment)
Table 172 Samsung: Product Benchmarking
Table 173 Samsung: Strategic Outlook
Table 174 Siemens Healthineers AG: Key Details, (CEO, HQ, Revenue, Founded, No. of Employees, Company Type, Website, Business Segment)
Table 175 Siemens Healthineers AG: Product Benchmarking
Table 176 Siemens Healthineers AG: Strategic Outlook
Table 177 Telefónica IoT & Big Data Tech, S.A.U.: Key Details, (CEO, HQ, Revenue, Founded, No. of Employees, Company Type, Website, Business Segment)
Table 178 Telefónica IoT & Big Data Tech, S.A.U.: Product Benchmarking
Table 179 Telefónica IoT & Big Data Tech, S.A.U.: Strategic Outlook
List of Figures
Figure 1 Mobile and Digital Health Technologies Segmentation
Figure 2 Mobile and Digital Health Technologies Market by Technology: Market Attractiveness Index
Figure 3 Mobile and Digital Health Technologies by Component: Market Attractiveness Index
Figure 4 Mobile and Digital Health Technologies by Application: Market Attractiveness Index
Figure 5 Mobile and Digital Health Technologies by End-users: Market Attractiveness Index
Figure 6 Mobile and Digital Health Technologies Attractiveness Index by Region
Figure 7 Mobile and Digital Health Technologies: Market Dynamics
Figure 8 Mobile and Digital Health Technologies by Region, 2024-2034 (US$ Billion, AGR %): “V” Shaped Recovery
Figure 9 Mobile and Digital Health Technologies by Region, 2024-2034 (US$ Billion, AGR %): “U” Shaped Recovery
Figure 10 Mobile and Digital Health Technologies by Region, 2024-2034 (US$ Billion, AGR %): “W” Shaped Recovery
Figure 11 Mobile and Digital Health Technologies by Region, 2024-2034 (US$ Billion, AGR %): “L” Shaped Recovery
Figure 12 Mobile and Digital Health Technologies Market: Porter’s Five Forces Analysis
Figure 13 Mobile and Digital Health Technologies: PEST Analysis
Figure 14 Mobile and Digital Health Technologies by Technology: Market Attractiveness Index
Figure 15 Mobile and Digital Health Technologies Forecast by Technology, 2024-2034 (US$ Billion, AGR %)
Figure 16 Mobile and Digital Health Technologies Share Forecast by Technology, 2024, 2029, 2034 (%)
Figure 17 Mobile and Digital Health Technologies Forecast by Tele-healthcare, 2024-2034 (US$ Billion, AGR %)
Figure 18 Mobile and Digital Health Technologies Share Forecast by Tele-healthcare, 2024, 2034 (%)
Figure 19 Mobile and Digital Health Technologies Market Forecast by Telecare, 2024-2034 (US$ Billion, AGR %)
Figure 20 Telecare Segment Market Forecast by Region, 2024-2034 (US$ Billion, AGR %)
Figure 21 Telecare Segment Market Share Forecast by Region, 2024 & 2034 (%)
Figure 22 Mobile and Digital Health Technologies Market Forecast by Telehealth, 2024-2034 (US$ Billion, AGR %)
Figure 23 Activity Monitoring Segment Market Forecast by Region, 2024-2034 (US$ Billion, AGR %)
Figure 24 Activity Monitoring Segment Market Share Forecast by Region, 2024 & 2034 (%)
Figure 25 Remote Medication Management Segment Market Forecast by Region, 2024-2034 (US$ Billion, AGR %)
Figure 26 Remote Medication Management Segment Market Share Forecast by Region, 2024 & 2034 (%)
Figure 27 Telehealth Segment Market Forecast by Region, 2024-2034 (US$ Billion, AGR %)
Figure 28 Telehealth Segment Market Share Forecast by Region, 2024 & 2034 (%)
Figure 29 LTC Monitoring Segment Market Forecast by Region, 2024-2034 (US$ Billion, AGR %)
Figure 30 LTC Monitoring Segment Market Share Forecast by Region, 2024 & 2034 (%)
Figure 31 Video Consultation Segment Market Forecast by Region, 2024-2034 (US$ Billion, AGR %)
Figure 32 Video Consultation Segment Market Share Forecast by Region, 2024 & 2034 (%)
Figure 33 Mobile and Digital Health Technologies Forecast by mHealth, 2024-2034 (US$ Billion, AGR %)
Figure 34 Mobile and Digital Health Technologies Share Forecast by mHealth, 2024, 2034 (%)
Figure 35 Mobile and Digital Health Technologies Market Forecast by Wearables, 2024-2034 (US$ Billion, AGR %)
Figure 36 Wearables Segment Market Forecast by Region, 2024-2034 (US$ Billion, AGR %)
Figure 37 Wearables Segment Market Share Forecast by Region, 2024 & 2034 (%)
Figure 38 BP Monitor Segment Market Forecast by Region, 2024-2034 (US$ Billion, AGR %)
Figure 39 BP Monitor Segment Market Share Forecast by Region, 2024 & 2034 (%)
Figure 40 Glucose Meter Segment Market Forecast by Region, 2024-2034 (US$ Billion, AGR %)
Figure 41 Glucose Meter Segment Market Share Forecast by Region, 2024 & 2034 (%)
Figure 42 Pulse Oximeter Segment Market Forecast by Region, 2024-2034 (US$ Billion, AGR %)
Figure 43 Pulse Oximeter Segment Market Share Forecast by Region, 2024 & 2034 (%)
Figure 44 Sleep Apnea Monitors Segment Market Forecast by Region, 2024-2034 (US$ Billion, AGR %)
Figure 45 Sleep Apnea Monitors Segment Market Share Forecast by Region, 2024 & 2034 (%)
Figure 46 Neurological Monitors Segment Market Forecast by Region, 2024-2034 (US$ Billion, AGR %)
Figure 47 Neurological Monitors Segment Market Share Forecast by Region, 2024 & 2034 (%)
Figure 48 Others Segment Market Forecast by Region, 2024-2034 (US$ Billion, AGR %)
Figure 49 Others Segment Market Share Forecast by Region, 2024 & 2034 (%)
Figure 50 Mobile and Digital Health Technologies Market Forecast by Apps, 2024-2034 (US$ Billion, AGR %)
Figure 51 Apps Segment Market Forecast by Region, 2024-2034 (US$ Billion, AGR %)
Figure 52 Apps Segment Market Share Forecast by Region, 2024 & 2034 (%)
Figure 53 Medical Apps Segment Market Forecast by Region, 2024-2034 (US$ Billion, AGR %)
Figure 54 Medical Apps Segment Market Share Forecast by Region, 2024 & 2034 (%)
Figure 55 Fitness Apps Segment Market Forecast by Region, 2024-2034 (US$ Billion, AGR %)
Figure 56 Fitness Apps Segment Market Share Forecast by Region, 2024 & 2034 (%)
Figure 57 Mobile and Digital Health Technologies Forecast by Digital Health Systems, 2024-2034 (US$ Billion, AGR %)
Figure 58 Mobile and Digital Health Technologies Share Forecast by Digital Health Systems, 2024, 2034 (%)
Figure 59 Electronic Health Records Segment Market Forecast by Region, 2024-2034 (US$ Billion, AGR %)
Figure 60 Electronic Health Records Segment Market Share Forecast by Region, 2024 & 2034 (%)
Figure 61 E-Prescribing Systems Segment Market Forecast by Region, 2024-2034 (US$ Billion, AGR %)
Figure 62 E-Prescribing Systems Segment Market Share Forecast by Region, 2024 & 2034 (%)
Figure 63 Health Analytics Segment Market Forecast by Region, 2024-2034 (US$ Billion, AGR %)
Figure 64 Health Analytics Segment Market Share Forecast by Region, 2024 & 2034 (%)
Figure 65 Mobile and Digital Health Technologies by Component: Market Attractiveness Index
Figure 66 Mobile and Digital Health Technologies Forecast by Component, 2024-2034 (US$ Billion, AGR %)
Figure 67 Mobile and Digital Health Technologies Share Forecast by Component, 2024, 2029, 2034 (%)
Figure 68 Hardware Segment Market Forecast by Region, 2024-2034 (US$ Billion, AGR %)
Figure 69 Hardware Segment Market Share Forecast by Region, 2024 & 2034 (%)
Figure 70 Software Market Forecast by Region, 2024-2034 (US$ Billion, AGR %)
Figure 71 Software Market Share Forecast by Region, 2024 & 2034 (%)
Figure 72 Services Market Forecast by Region, 2024-2034 (US$ Billion, AGR %)
Figure 73 Services Market Share Forecast by Region, 2024 & 2034 (%)
Figure 74 Mobile and Digital Health Technologies by Application: Market Attractiveness Index
Figure 75 Mobile and Digital Health Technologies Forecast by Application 2024-2034 (US$ Billion, AGR %)
Figure 76 Mobile and Digital Health Technologies Market Share Forecast by Application, 2024, 2029, 2034 (%)
Figure 77 Cardiology Market Forecast by Region, 2024-2034 (US$ Billion, AGR %)
Figure 78 Cardiology Market Share Forecast by Region, 2024 & 2034 (%)
Figure 79 Diabetes Market Forecast by Region, 2024-2034 (US$ Billion, AGR %)
Figure 80 Diabetes Market Share Forecast by Region, 2024 & 2034 (%)
Figure 81 Obesity Market Forecast by Region, 2024-2034 (US$ Billion, AGR %)
Figure 82 Obesity Market Share Forecast by Region, 2024 & 2034 (%)
Figure 83 Neurology Market Forecast by Region, 2024-2034 (US$ Billion, AGR %)
Figure 84 Neurology Segment Market Share Forecast by Region, 2024 & 2034 (%)
Figure 85 Sleep Apnea Market Forecast by Region, 2024-2034 (US$ Billion, AGR %)
Figure 86 Sleep Apnea Segment Market Share Forecast by Region, 2024 & 2034 (%)
Figure 87 Others Market Forecast by Region, 2024-2034 (US$ Billion, AGR %)
Figure 88 Others Segment Market Share Forecast by Region, 2024 & 2034 (%)
Figure 89 Mobile and Digital Health Technologies by End-users: Market Attractiveness Index
Figure 90 Mobile and Digital Health Technologies Forecast by End-users, 2024-2034 (US$ Billion, AGR %)
Figure 91 Mobile and Digital Health Technologies Market Share Forecast by End-users, 2024, 2029, 2034 (%)
Figure 92 Healthcare Providers Segment Market Forecast by Region, 2024-2034 (US$ Billion, AGR %)
Figure 93 Healthcare Providers Segment Market Share Forecast by Region, 2024 & 2034 (%)
Figure 94 Healthcare Payers Market Forecast by Region, 2024-2034 (US$ Billion, AGR %)
Figure 95 Healthcare Payers Market Share Forecast by Region, 2024 & 2034 (%)
Figure 96 Healthcare Consumers Segment Market Forecast by Region, 2024-2034 (US$ Billion, AGR %)
Figure 97 Healthcare Consumers Segment Market Share Forecast by Region, 2024 & 2034 (%)
Figure 98 Others Segment Market Forecast by Region, 2024-2034 (US$ Billion, AGR %)
Figure 99 Others Segment Market Share Forecast by Region, 2024 & 2034 (%)
Figure 100 Mobile and Digital Health Technologies Forecast by Region 2023 and 2033 (Revenue, CAGR %)
Figure 101 Mobile and Digital Health Technologies Market Share Forecast by Region 2024, 2029, 2034 (%)
Figure 102 Mobile and Digital Health Technologies by Region, 2024-2034 (US$ Billion, AGR %)
Figure 103 North America Mobile and Digital Health Technologies Attractiveness Index
Figure 104 North America Mobile and Digital Health Technologies by Region, 2024, 2029 & 2034 (US$ Billion)
Figure 105 North America Mobile and Digital Health Technologies Forecast by Country, 2024-2034 (US$ Billion, AGR %)
Figure 106 North America Mobile and Digital Health Technologies Share Forecast by Country, 2024 & 2034 (%)
Figure 107 North America Mobile and Digital Health Technologies Forecast by Technology, 2024-2034 (US$ Billion, AGR %)
Figure 108 North America Mobile and Digital Health Technologies Share Forecast by Technology, 2024 & 2034 (%)
Figure 109 North America Mobile and Digital Health Technologies Forecast by Tele-healthcare, 2024-2034 (US$ Billion, AGR %)
Figure 110 North America Mobile and Digital Health Technologies Forecast by mHealth, 2024-2034 (US$ Billion, AGR %)
Figure 111 North America Mobile and Digital Health Technologies Forecast by Digital Health Systems, 2024-2034 (US$ Billion, AGR %)
Figure 112 North America Mobile and Digital Health Technologies Forecast by Component, 2024-2034 (US$ Billion, AGR %)
Figure 113 North America Mobile and Digital Health Technologies Share Forecast by Component, 2024 & 2034 (%)
Figure 114 North America Mobile and Digital Health Technologies Forecast by Application, 2024-2034 (US$ Billion, AGR %)
Figure 115 North America Mobile and Digital Health Technologies Share Forecast by Application, 2024 & 2034 (%)
Figure 116 North America Mobile and Digital Health Technologies Forecast by End-users, 2024-2034 (US$ Billion, AGR %)
Figure 117 North America Mobile and Digital Health Technologies Share Forecast by End-users, 2024 & 2034 (%)
Figure 118 U.S. Mobile and Digital Health Technologies Forecast, 2024-2034 (US$ Billion, AGR %)
Figure 119 Canada Mobile and Digital Health Technologies Forecast, 2024-2034 (US$ Billion, AGR %)
Figure 120 Europe Mobile and Digital Health Technologies Attractiveness Index
Figure 121 Europe Mobile and Digital Health Technologies by Region, 2024, 2029 & 2034 (US$ Billion)
Figure 122 Europe Mobile and Digital Health Technologies Forecast by Country, 2024-2034 (US$ Billion, AGR %)
Figure 123 Europe Mobile and Digital Health Technologies Share Forecast by Country, 2024 & 2034 (%)
Figure 124 Europe Mobile and Digital Health Technologies Forecast by Technology, 2024-2034 (US$ Billion, AGR %)
Figure 125 Europe Mobile and Digital Health Technologies Share Forecast by Technology, 2024 & 2034 (%)
Figure 126 Europe Mobile and Digital Health Technologies Market Forecast by Telehealthcare, 2024-2034 (US$ Billion, AGR %)
Figure 127 Europe Mobile and Digital Health Technologies Market Forecast by mHealth, 2024-2034 (US$ Billion, AGR %)
Figure 128 Europe Mobile and Digital Health Technologies Market by Digital Health Systems, 2024-2034 (US$ Billion, AGR %)
Figure 129 Europe Mobile and Digital Health Technologies Forecast by Component, 2024-2034 (US$ Billion, AGR %)
Figure 130 Europe Mobile and Digital Health Technologies Share Forecast by Component, 2024 & 2034 (%)
Figure 131 Europe Mobile and Digital Health Technologies Forecast by Application, 2024-2034 (US$ Billion, AGR %)
Figure 132 Europe Mobile and Digital Health Technologies Share Forecast by Application, 2024 & 2034 (%)
Figure 133 Europe Mobile and Digital Health Technologies Forecast by End-users, 2024-2034 (US$ Billion, AGR %)
Figure 134 Europe Mobile and Digital Health Technologies Share Forecast by End-users, 2024 & 2034 (%)
Figure 135 Germany Mobile and Digital Health Technologies Forecast, 2024-2034 (US$ Billion, AGR %)
Figure 136 France Mobile and Digital Health Technologies Forecast, 2024-2034 (US$ Billion, AGR %)
Figure 137 UK Mobile and Digital Health Technologies Forecast, 2024-2034 (US$ Billion, AGR %)
Figure 138 Italy Mobile and Digital Health Technologies Forecast, 2024-2034 (US$ Billion, AGR %)
Figure 139 Spain Mobile and Digital Health Technologies Forecast, 2024-2034 (US$ Billion, AGR %)
Figure 140 Russia Mobile and Digital Health Technologies Forecast, 2024-2034 (US$ Billion, AGR %)
Figure 141 Poland Mobile and Digital Health Technologies Forecast, 2024-2034 (US$ Billion, AGR %)
Figure 142 Belgium Mobile and Digital Health Technologies Forecast, 2024-2034 (US$ Billion, AGR %)
Figure 143 Rest of Europe Mobile and Digital Health Technologies Forecast, 2024-2034 (US$ Billion, AGR %)
Figure 144 Asia Pacific Mobile and Digital Health Technologies Attractiveness Index
Figure 145 Asia Pacific Mobile and Digital Health Technologies by Region, 2024, 2029 & 2034 (US$ Billion)
Figure 146 Asia Pacific Mobile and Digital Health Technologies Forecast by Country, 2024-2034 (US$ Billion, AGR %)
Figure 147 Asia Pacific Mobile and Digital Health Technologies Share Forecast by Country, 2024 & 2034 (%)
Figure 148 Asia Pacific Mobile and Digital Health Technologies Forecast by Technology, 2024-2034 (US$ Billion, AGR %)
Figure 149 Asia Pacific Mobile and Digital Health Technologies Share Forecast by Technology, 2024 & 2034 (%)
Figure 150 Asia Pacific Mobile and Digital Health Technologies Forecast by Tele-healthcare, 2024-2034 (US$ Billion, AGR %)
Figure 151 Asia Pacific Mobile and Digital Health Technologies Market Forecast by mHealth, 2024-2034 (US$ Billion, AGR %)
Figure 152 Asia Pacific Mobile and Digital Health Technologies Market Forecast by Digital Health Systems, 2024-2034 (US$ Billion, AGR %)
Figure 153 Asia Pacific Mobile and Digital Health Technologies Forecast by Component, 2024-2034 (US$ Billion, AGR %)
Figure 154 Asia Pacific Mobile and Digital Health Technologies Share Forecast by Component, 2024 & 2034 (%)
Figure 155 Asia Pacific Mobile and Digital Health Technologies Forecast by Application, 2024-2034 (US$ Billion, AGR %)
Figure 156 Asia Pacific Mobile and Digital Health Technologies Share Forecast by Application, 2024 & 2034 (%)
Figure 157 Asia Pacific Mobile and Digital Health Technologies Forecast by End-users, 2024-2034 (US$ Billion, AGR %)
Figure 158 Asia Pacific Mobile and Digital Health Technologies Share Forecast by End-users, 2024 & 2034 (%)
Figure 159 Japan Mobile and Digital Health Technologies Forecast, 2024-2034 (US$ Billion, AGR %)
Figure 160 China Mobile and Digital Health Technologies Forecast, 2024-2034 (US$ Billion, AGR %)
Figure 161 India Mobile and Digital Health Technologies Forecast, 2024-2034 (US$ Billion, AGR %)
Figure 162 Australia Mobile and Digital Health Technologies Forecast, 2024-2034 (US$ Billion, AGR %)
Figure 163 South Korea Mobile and Digital Health Technologies Forecast, 2024-2034 (US$ Billion, AGR %)
Figure 164 Singapore Mobile and Digital Health Technologies Forecast, 2024-2034 (US$ Billion, AGR %)
Figure 165 Taiwan Mobile and Digital Health Technologies Forecast, 2024-2034 (US$ Billion, AGR %)
Figure 166 Rest of Asia Pacific Mobile and Digital Health Technologies Forecast, 2024-2034 (US$ Billion, AGR %)
Figure 167 Latin America Mobile and Digital Health Technologies Attractiveness Index
Figure 168 Latin America Mobile and Digital Health Technologies by Region, 2024, 2029 & 2034 (US$ Billion)
Figure 169 Latin America Mobile and Digital Health Technologies Forecast by Country, 2024-2034 (US$ Billion, AGR %)
Figure 170 Latin America Mobile and Digital Health Technologies Share Forecast by Country, 2024 & 2034 (%)
Figure 171 Latin America Mobile and Digital Health Technologies Forecast by Technology, 2024-2034 (US$ Billion, AGR %)
Figure 172 Latin America Mobile and Digital Health Technologies Share Forecast by Technology, 2024 & 2034 (%)
Figure 173 Latin America Mobile and Digital Health Technologies Forecast by Tele-healthcare, 2024-2034 (US$ Billion, AGR %)
Figure 174 Latin America Mobile and Digital Health Technologies Forecast by mHealth, 2024-2034 (US$ Billion, AGR %)
Figure 175 Latin America Mobile and Digital Health Technologies Forecast by Digital Health Systems, 2024-2034 (US$ Billion, AGR %)
Figure 176 Latin America Mobile and Digital Health Technologies Forecast by Component, 2024-2034 (US$ Billion, AGR %)
Figure 177 Latin America Mobile and Digital Health Technologies Share Forecast by Component, 2024 & 2034 (%)
Figure 178 Latin America Mobile and Digital Health Technologies Forecast by Application, 2024-2034 (US$ Billion, AGR %)
Figure 179 Latin America Mobile and Digital Health Technologies Share Forecast by Application, 2024 & 2034 (%)
Figure 180 Latin America Mobile and Digital Health Technologies Forecast by End-users, 2024-2034 (US$ Billion, AGR %)
Figure 181 Latin America Mobile and Digital Health Technologies Share Forecast by End-users, 2024 & 2034 (%)
Figure 182 Brazil Mobile and Digital Health Technologies Forecast, 2024-2034 (US$ Billion, AGR %)
Figure 183 Mexico Mobile and Digital Health Technologies Forecast, 2024-2034 (US$ Billion, AGR %)
Figure 184 Argentina Mobile and Digital Health Technologies Forecast, 2024-2034 (US$ Billion, AGR %)
Figure 185 Colombia Mobile and Digital Health Technologies Forecast, 2024-2034 (US$ Billion, AGR %)
Figure 186 Rest of Latin America Mobile and Digital Health Technologies Forecast, 2024-2034 (US$ Billion, AGR %)
Figure 187 MEA Mobile and Digital Health Technologies Attractiveness Index
Figure 188 MEA Mobile and Digital Health Technologies by Region, 2024, 2029 & 2034 (US$ Billion)
Figure 189 MEA Mobile and Digital Health Technologies Forecast by Country, 2024-2034 (US$ Billion, AGR %)
Figure 190 MEA Mobile and Digital Health Technologies Share Forecast by Country, 2024 & 2034 (%)
Figure 191 MEA Mobile and Digital Health Technologies Forecast by Technology, 2024-2034 (US$ Billion, AGR %)
Figure 192 MEA Mobile and Digital Health Technologies Share Forecast by Technology, 2024 & 2034 (%)
Figure 193 MEA Mobile and Digital Health Technologies Size Estimation and Forecast by Tele-healthcare, 2024-2034 (US$ Billion, AGR %)
Figure 194 MEA Mobile and Digital Health Technologies Size Estimation and Forecast by mHealth, 2024-2034 (US$ Billion, AGR %)
Figure 195 MEA Mobile and Digital Health Technologies Forecast by Digital Health Systems, 2024-2034 (US$ Billion, AGR %)
Figure 196 MEA Mobile and Digital Health Technologies Forecast by Component, 2024-2034 (US$ Billion, AGR %)
Figure 197 MEA Mobile and Digital Health Technologies Share Forecast by Component, 2024 & 2034 (%)
Figure 198 MEA Mobile and Digital Health Technologies Forecast by Application, 2024-2034 (US$ Billion, AGR %)
Figure 199 MEA Mobile and Digital Health Technologies Share Forecast by Application, 2024 & 2034 (%)
Figure 200 MEA Mobile and Digital Health Technologies Forecast by End-users, 2024-2034 (US$ Billion, AGR %)
Figure 201 MEA Mobile and Digital Health Technologies Share Forecast by End-users, 2024 & 2034 (%)
Figure 202 GCC Mobile and Digital Health Technologies Forecast, 2024-2034 (US$ Billion, AGR %)
Figure 203 South Africa Mobile and Digital Health Technologies Forecast, 2024-2034 (US$ Billion, AGR %)
Figure 204 Rest of MEA Mobile and Digital Health Technologies Forecast, 2024-2034 (US$ Billion, AGR %)
Figure 205 Mobile and Digital Health Technologies Market: Company Share, 2023
Figure 206 Allscripts Healthcare Solutions Inc. (Veradigm LLC).: Net Revenue, 2017-2022 (US$ Million, AGR %)
Figure 207 Allscripts Healthcare Solutions Inc. (Veradigm LLC): R&D, 2017-2021 (US$ Million, AGR%)
Figure 208 Allscripts Healthcare Solutions Inc. (Veradigm LLC): Regional Market Shares (%), 2022
Figure 209 Apple Inc.: Net Revenue, 2017-2023 (US$ Million, AGR %)
Figure 210 Apple Inc.: R&D, 2017-2023 (US$ Million, AGR%)
Figure 211 Apple Inc.: Regional Market Shares (%), 2023
Figure 212 AT&T: Net Revenue, 2017-2023 (US$ Million, AGR %)
Figure 213 AT&T: Regional Market Shares (%), 2023
Figure 214 BioTelemetry Inc: Net Revenue, 2017-2019 (US$ Million, AGR%)
Figure 215 BioTelemetry Inc: R&D, 2017-2019 (US$ Million, AGR%)
Figure 216 Oracle (Cerner Corporation): Net Revenue, 2017-2023 (US$ Million, AGR%)
Figure 217 Oracle (Cerner Corporation): R&D, 2017-2023 (US$ Million, AGR%)
Figure 218 Oracle (Cerner Corporation): Regional Market Shares (%), 2023
Figure 219 Cisco Systems, Inc.: Net Revenue, 2017-2023 (US$ Million, AGR%)
Figure 220 Cisco Systems, Inc.: R&D, 2017-2023 (US$ Million, AGR%)
Figure 221 Cisco Systems, Inc.: Regional Market Shares (%), 2023
Figure 222 GE HealthCare.: Net Revenue, 2017-2023 (US$ Million, AGR%)
Figure 223 GE HealthCare.: R&D, 2017-2023 (US$ Million, AGR%)
Figure 224 IBM: Net Revenue, 2017-2023 (US$ Million, AGR%)
Figure 225 IBM: R&D, 2017-2023 (US$ Million, AGR%)
Figure 226 IBM: Regional Market Shares (%), 2023
Figure 227 Koninklijke Philips N.V: Net Revenue, 2017-2023 (US$ Million, AGR %)
Figure 228 Koninklijke Philips N.V: R&D, 2017-2023 (US$ Million, AGR%)
Figure 229 Koninklijke Philips N.V: Regional Market Shares (%), 2023
Figure 230 McKesson Corporation: Net Revenue, 2017-2023 (US$ Million, AGR %)
Figure 231 McKesson Corporation: Regional Market Shares (%), 2023
Figure 232 Omron Corporation: Net Revenue, 2017-2023 (US$ Million, AGR %)
Figure 233 Omron Corporation: R&D, 2019-2023 (US$ Million, AGR%)
Figure 234 Omron Corporation: Regional Market Shares (%), 2023
Figure 235 Qualcomm Technologies, Inc.: Net Revenue, 2017-2023 (US$ Million, AGR %)
Figure 236 Samsung: Net Revenue, 2017-2023 (US$ Million, AGR %)
Figure 237 Siemens Healthineers AG: Net Revenue, 2017-2023 (US$ Million, AGR %)
Figure 238 Siemens Healthineers AG: R&D, 2019-2023 (US$ Million, AGR%)
Figure 239 Siemens Healthineers AG: Regional Market Shares (%), 2023
Figure 240 Telefónica IoT & Big Data Tech, S.A.U.: Net Revenue, 2017-2023 (US$ Million, AGR %)
ページTOPに戻る
- Healthcare ERP Market Size, Share & Trends Analysis Report By Function (Inventory & Material Management, Supply Chain & Logistics Management, Patient Relationship Management, Finance & Billing), By Deployment (On-Premises, Cloud), By Region, And Segment Forecasts, 2026 - 2033
- Telehealth Market Size, Share & Trends Analysis Report By Product Type (Hardware, Software, Services), By Delivery Mode (On-premises, Web-based, Cloud-based), By Disease Area (Psychiatry), By End Use, By Region, And Segment Forecasts, 2026 - 2033
- 医療コンプライアンスソフトウェア市場の規模、シェアおよび動向分析レポート:製品タイプ別(オンプレミス、クラウド型)、カテゴリー別(方針・手順管理、監査ツール)、最終用途別、地域別、およびセグメント別予測(2026年~2033年)
- ADHD Apps Market Size, Share & Trends Analysis Report By App Type (Behavioral Management Apps, Cognitive Training & Gamified Apps), By User Age Group, By Platform, By End Use (Parents & Caregivers, Healthcare Providers), By Region, And Segment Forecasts, 2026 - 2033
- Pharmacovigilance Market Size, Share & Trends Analysis Report By Product Life Cycle (Pre-clinical, Phase I, Phase II, Phase III), By Service Provider (In-house, Contract Outsourcing), By Type, By Therapeutic Area, By Process Flow, By End Use, By Region, And Segment Forecasts, 2026 - 2033
- 水分補給サプリメント市場の動向、競合状況、および市場予測 ― 2033年
- 高性能医療用プラスチック市場の動向、競合状況、および市場予測 - 2033年
- デジタルヘルスケア・サプライチェーン管理市場の規模、シェア、動向分析レポート:製品別(ハードウェア、ソフトウェア、サービス)、導入形態別(Webベース、クラウドベース)、最終用途別(医療機器、医薬品)、地域別、およびセグメント別予測(2026年~2033年)
- 米国の電子カルテ市場規模、シェアおよび動向分析レポート:製品別、タイプ別(急性期、外来、急性期後)、ビジネスモデル別(専門サービス、サブスクリプション)、用途別、エンドユーザー別、およびセグメント別予測(2026年~2033年)
- 医療ツーリズム市場の規模、シェアおよび動向分析レポート:治療種別(心血管治療、整形外科治療、不妊治療、代替医療)、サービス提供者別、国別、およびセグメント別予測(2026年~2035年)
本レポートと同じKEY WORD(mobile)の最新刊レポート
- 本レポートと同じKEY WORDの最新刊レポートはありません。
よくあるご質問
Visiongain社はどのような調査会社ですか?
英国の調査会社ヴィジョンゲイン社(Visiongain)は、通信とエネルギーのほか、自動車や化学・医薬品、金属など、広範な市場を対象に調査を行っています。自動車市場については、市場全般に関する調査のほ... もっと見る
調査レポートの納品までの日数はどの程度ですか?
在庫のあるものは速納となりますが、平均的には 3-4日と見て下さい。
但し、一部の調査レポートでは、発注を受けた段階で内容更新をして納品をする場合もあります。
発注をする前のお問合せをお願いします。
注文の手続きはどのようになっていますか?
1)お客様からの御問い合わせをいただきます。
2)見積書やサンプルの提示をいたします。
3)お客様指定、もしくは弊社の発注書をメール添付にて発送してください。
4)データリソース社からレポート発行元の調査会社へ納品手配します。
5) 調査会社からお客様へ納品されます。最近は、pdfにてのメール納品が大半です。
お支払方法の方法はどのようになっていますか?
納品と同時にデータリソース社よりお客様へ請求書(必要に応じて納品書も)を発送いたします。
お客様よりデータリソース社へ(通常は円払い)の御振り込みをお願いします。
請求書は、納品日の日付で発行しますので、翌月最終営業日までの当社指定口座への振込みをお願いします。振込み手数料は御社負担にてお願いします。
お客様の御支払い条件が60日以上の場合は御相談ください。
尚、初めてのお取引先や個人の場合、前払いをお願いすることもあります。ご了承のほど、お願いします。
データリソース社はどのような会社ですか?
当社は、世界各国の主要調査会社・レポート出版社と提携し、世界各国の市場調査レポートや技術動向レポートなどを日本国内の企業・公官庁及び教育研究機関に提供しております。
世界各国の「市場・技術・法規制などの」実情を調査・収集される時には、データリソース社にご相談ください。
お客様の御要望にあったデータや情報を抽出する為のレポート紹介や調査のアドバイスも致します。
|
|

