アジア太平洋地域のPOS端末調査 - 2024年Asia/Pacific POS Terminal Study - 2024 製品概要 2024年アジア太平洋地域のPOS端末に関する調査では、アジア太平洋地域全体のPOS端末の市場環境を調査しています。 地域別各国・地域の一般的な小売環境とともに、以下の小売市場セグメ... もっと見る
その他の価格についてはデータリソースまでお問合せください。
サマリー製品概要 2024年アジア太平洋地域のPOS端末に関する調査では、アジア太平洋地域全体のPOS端末の市場環境を調査しています。 地域別各国・地域の一般的な小売環境とともに、以下の小売市場セグメントについて、国別の出荷台数、設置台数、予測を解説する:
ハイライト 各国・地域の一般的な小売環境とともに、以下の小売市場セグメントについて、国別の出荷台数、設置台数、予測を解説する:
プレビュー
よくあるご質問 POSとは何ですか?IHLでは、何をPOSデバイスとして分類するのか、その定義を明確に示すことが重要であると考えている。当社の分析では、POS を PC ベースのワークステーション、すなわち PC クラスのプロセッサーベース端末および LAN 利用可能端末と定義している。電子送金端末をPOSに含める人もいるかもしれないが、ここでは含めない。 今回の調査では、PCオン・キャッシュ・ドロワー・デバイス(PCOCD)を含めているが、特定の市場が大きな影響を受けない限り、ベンダーを区別しようとはしていない。 電子レジスター(ECR)は本調査には含まれていない。POSとECRは、プロセッサーと接続性という点では境界が曖昧になっているが、機能性、拡張性、サービス性という点では明確に区別されると考えている。 本レポートは市場セグメント情報にも注目しているため、各市場セグメントに含まれる金融機関のタイプを区別することが重要である。以下の通りである: 食料品/食料雑貨: これは食料品店であり、その規模は、単一レーンのママ&ポップストアから複数レーンのフルサービス・スーパーマーケットまで様々である。 ドラッグストア/薬局:パーソナルケア用品や医薬品を販売する店舗で、1店舗につき1~5台の端末を設置できる。 ハイパーマーケット:これは、国によって異なる幅広いセグメントである。多くの国では、フルサービスの食料品店に加え、通常ディスカウントストアに含まれる商品も一つ屋根の下にある。他の国では、スーパーストアーのフォーマット(ウォルマート・スーパーセンターのようなもの)から、フルラインの食料品店とフルラインの百貨店(大型家電付き)まで、様々な店舗がある。 百貨店:伝統的に大型の店舗で、商品も高級で、デパート・スタイルのチェックアウトを備えたハード・ソフトグッズを含む。 量販店: ハイパーマーケットのような形態で、非食品または限られた食品のみを扱い、フロントエンドのチェックアウトを使用する。ディスカウントストアも含まれる。 専門店:ブラインドニッチな商品に特化したショップ。アパレル、ニュース、シューズ、DIYなどの店舗を紹介。 ホスピタリティだ: レストラン、バー、パブ、ホテル、コンビニエンスストア。 価格 ライセンスオプションエンタープライズライセンス - 組織内および完全子会社内の誰もが研究にアクセスし、社内で共有できるライセンス。 IHLグループ使用許諾および公正使用規約IHLグループの一般に入手可能な研究はすべて電子ライセンスであり、購入の際に選択したライセンスタイプによって制限されます。 についてシングルユーザーライセンスこれは、調査を購入した人だけがその調査を使用できることを意味する。 エンタープライズライセンスの場合、社内で自由に共有することができます。ただし、IHLグループの許可なく、購入企業以外のパートナーや他者と共有することはご遠慮ください。このライセンスは、ジョイントベンチャーやその他のパートナーシップには適用されません。完全子会社でない場合は、双方のライセンスが必要となります。 現実的には、これは次のことを意味する:
ディストリビュートライセンスの場合は、見込み顧客や潜在的な機関投資家と調査を共有することができる ライセンスを購入すべきパートナーや他のベンダーと共有することはできません。 目次目次 はじめに 1.トレンド/障壁 2.アジア/太平洋市場概要 2.1 POS出荷 歴史 2.2 POS設置台数の歴史 3.日本 3.1 小売の概要 3.2 POS出荷の歴史 3.3 POS設置台数の歴史 4.中国 4.1 小売の概要 4.2 POS出荷の歴史 4.3 POS設置台数の歴史 5.インド 5.1 小売業の概要 5.2 POS出荷台数の歴史 5.3 POS設置台数の歴史 6.オーストラリア / ニュージーランド 6.1 小売業の概要 6.2 POS出荷台数の歴史 6.3 POS設置台数の歴史 7. 韓国 7.1 小売業の概要 7.2 POS出荷台数の歴史 7.3 POS設置台数の歴史 8.ベトナム 8.1 小売の概要 8.2 POS 出荷履歴 8.3 POS設置台数の歴史 9.台湾 9.1 小売の概要 9.2 POS 出荷履歴 9.3 POS設置台数の歴史 10. 香港 10.1 小売の概要 10.2 POS 出荷履歴 10.3 POS設置台数の歴史 11.その他のアジア/太平洋 11.1 小売の概要 11.2 POS 出荷 歴史 11.3 POS設置台数の歴史 12. 総括表 12.1 2019年~2022年のセグメント別POS出荷台数履歴 12.2 2019年~2022年のセグメント別POS設置台数履歴 13.予測 12.1 2022~2027年のセグメント別出荷台数予測 12.2 2022~2027年のセグメント別設置台数予測 参考文献
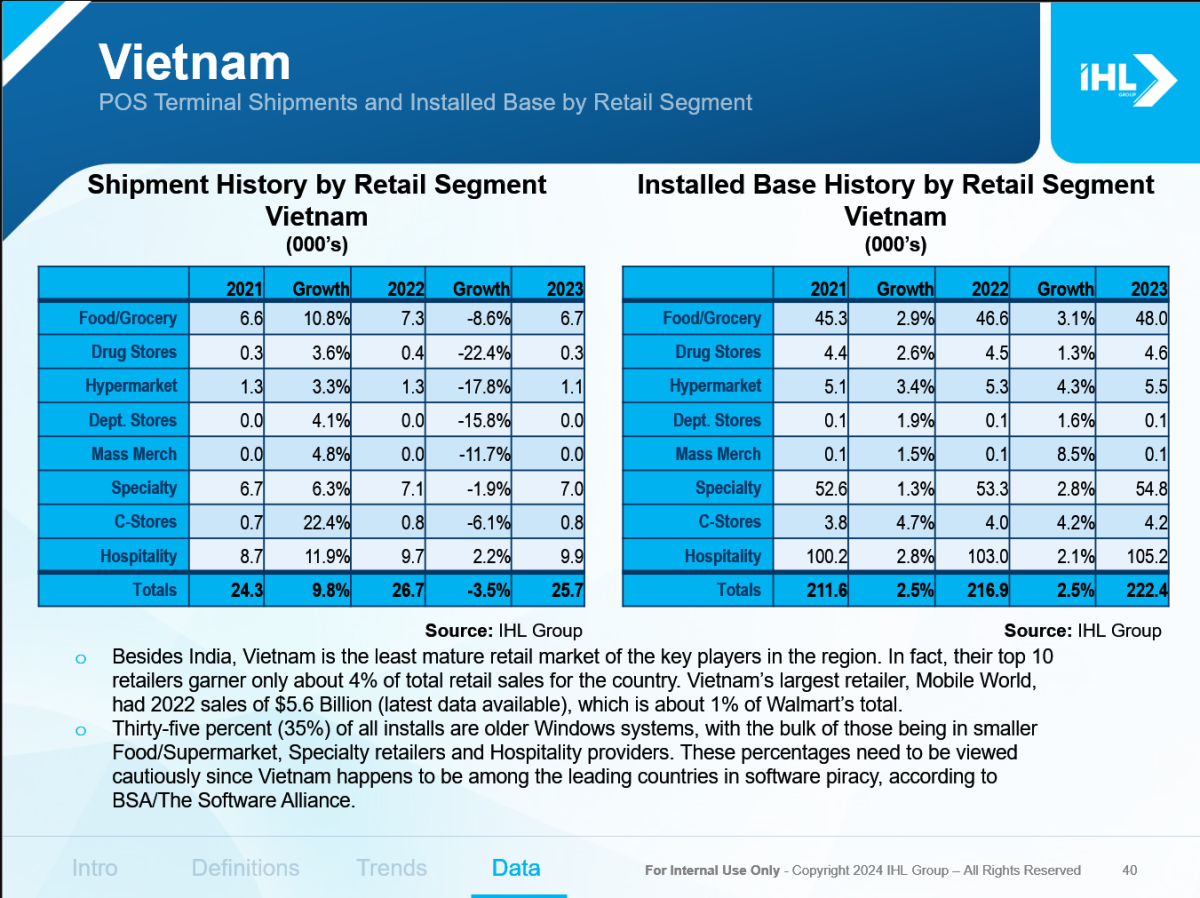
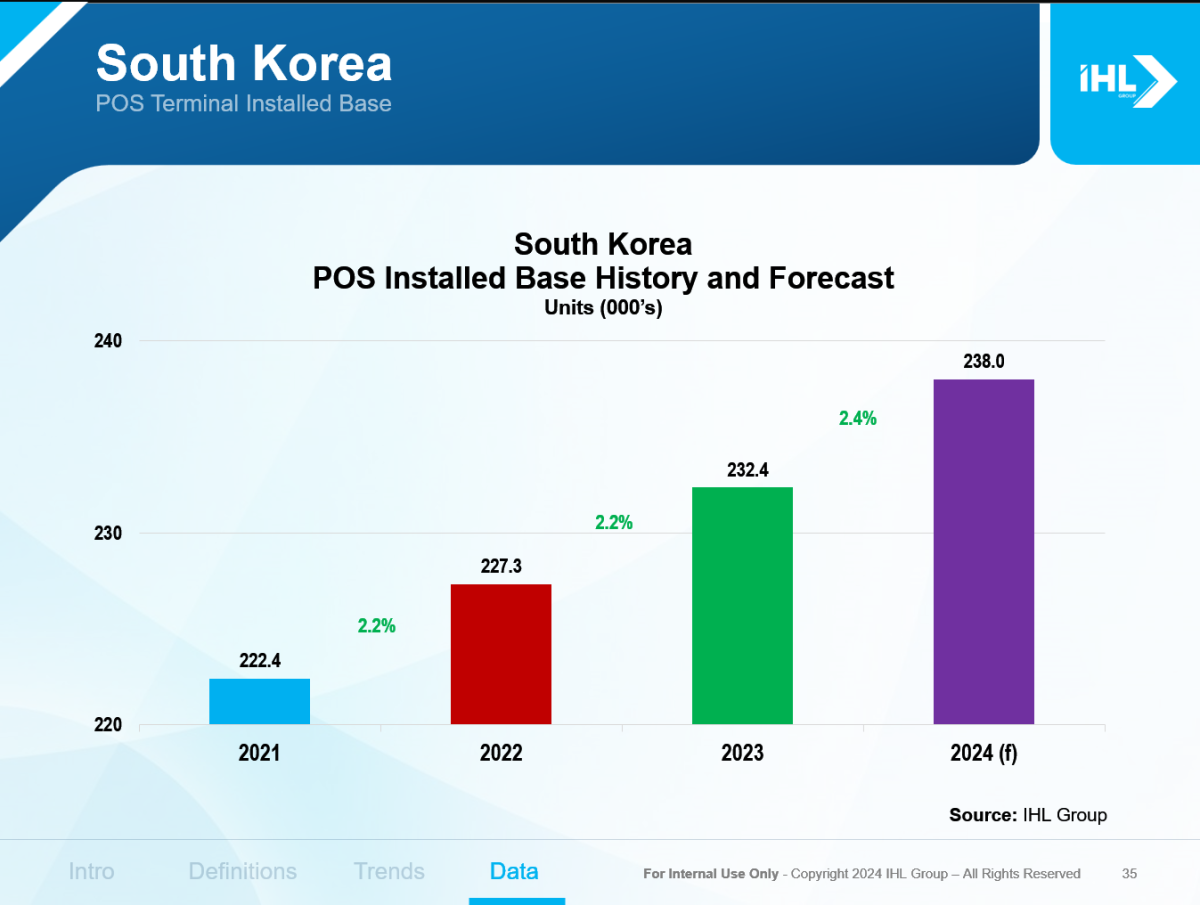
図表リスト図表一覧 図1 アジア太平洋地域のPOS 出荷の歴史と予測 図2 アジア太平洋地域のPOS設置台数の歴史と予測 図3 日本のPOS出荷履歴 予想 図4 日本のPOS設置台数の歴史予想 図 5 日本の小売セグメント別 POS 端末出荷台数と設置台数 図 6 中国の POS 出荷履歴 予想 図7 中国のPOS設置台数の歴史 予想 図 8 中国の小売セグメント別 POS 端末出荷台数と設置台数 図 9 インド POS 出荷履歴 予想 図 10 インド POS 設置台数の歴史 予想 図 11 インドの小売セグメント別 POS 端末出荷台数と設置台数 図 12 オーストラリア/ニュージーランド POS 出荷履歴 予想 図13 オーストラリア/ニュージーランドPOS設置ベース履歴 予想 図 14 オーストラリア/ニュージーランドの小売セグメント別 POS 端末出荷台数および設置台数 図 15 韓国 POS 出荷の歴史 予想 図 16 韓国 POS 設置台数の歴史 予想 図 17 韓国の小売セグメント別 POS 端末出荷台数と設置台数 図 18 ベトナムの POS 出荷履歴 予想 図 19 ベトナムの POS 設置台数推移 予想 図 20 ベトナムの小売セグメント別 POS 端末出荷台数および設置台数 図 21 台湾 POS 出荷履歴 予想 図22 台湾のPOS設置台数の歴史 予想 図 23 台湾の小売セグメント別 POS 端末出荷台数と設置台数 図 24 香港の POS 出荷履歴 予想 図25 香港のPOS設置台数の歴史 予想 図 26 香港の小売セグメント別 POS 端末出荷台数と設置台数 図 27 その他のアジア太平洋地域の POS 出荷履歴 予想 図 28 その他のアジア太平洋地域の POS 設置台数推移 予想 図 29 その他のアジア太平洋地域の小売セグメント別 POS 端末出荷台数および設置台数 図 30 2022 年~2027 年 アジア太平洋地域の小売セグメント別出荷予測 図 31 2022 年~2027 年 アジア太平洋地域の小売セグメント別設置台数予測
SummaryProduct Overview In our 2024 Asia/Pacific POS Terminal study we explore the market climate for POS terminals throughout the region Asia/Pacific region. Along with the general retail environment for each country/region, we discuss the country-by-country shipments, installed base, and forecasts for the following retail market segments:
Highlights Along with the general retail environment for each country/region, we discuss the country by country shipments, installed base, and forecasts for the following retail market segments:
Preview
FAQs What do you define as POS?At IHL we believe it is important that we state clearly the definitions of what we are classifying as a POS device. For the purposes of our analysis, we are defining POS as PC-based workstations, namely PC-class Processor-based and LAN-available terminals. Although others might include Electronic Funds Terminals as POS, we do not include them here. In our research, we do include PC on Cash Drawer Devices (PCOCD), however, we do not attempt to distinguish between vendors unless a particular market is affected significantly. We do not include Electronic Cash Registers (ECR’s) in our study. Although the lines have blurred as to POS and ECR in terms of processors and connectivity, we believe there is a clear distinction in functionality, expandability, and serviceability between the devices. As this report also looks at market segment information, it is important that we distinguish the types of institutions we include in each market segment. These are the following: Food/Grocery: This is a grocery store, and size can range from a single-lane, mom-and-pop store to a multi-lane full service supermarket. Drug Store/Pharmacy: This is store that sells personal care and medicinal items and can have from 1-5 terminals per store. Hypermarkets: This is a broad segment that varies by country. In many, it includes a full service Food store as well as products typically included at Discounters under one roof. In other countries, stores can range anywhere from a Superstore format (think Wal-Mart Supercenter) to a full-line Department Store (with large appliances) combined with a full-line Grocery store. Department Stores: Traditionally larger format stores, upscale in products and including hard and soft goods with department style checkout. Mass Merchandisers: Like a Hypermarket format, only carrying non-food items or limited food items and using a front-end checkout. Also includes Discounters. Specialty Stores: Stores that focus on particular product line niches. Includes apparel, news, shoes, and DIY type stores. Hospitality: Includes Restaurants, Bars, Pubs, Hotels, and Convenience Store outlets. Pricing License OptionsEnterprise License – a license that allows for the research to be accessed and shared internally with anyone else within the organization and wholly owned subsidiaries. IHL Group License and Fair Use AgreementAll of IHL Group’s generally available research are electronic licenses and are limited by the license type chosen for purchase. For Single User Licenses this means that the person buying the research is the only person to use the research. For Enterprise Licenses, these can be shared freely within the company. We only ask that this information not be shared with partners or others outside the purchasing company without authorization from IHL Group. The license does not extend to joint ventures or other partnerships. If the relationship is not a wholly-owned subsidiary, then both parties would need a license. Practically, this implies the following:
For Distributed Licenses, if applicable, the research can be shared with prospective customers and potential institutional investors. It cannot be shared with partners or other vendors who should be purchasing their own licenses. Table of ContentsTable of Contents INTRODUCTION 1. TRENDS/BARRIERS 2. ASIA/PACIFIC MARKET OVERVIEW 2.1 POS Shipment History 2.2 POS Installed Base History 3. JAPAN 3.1 Retail Overview 3.2 POS Shipment History 3.3 POS Installed Base History 4. CHINA 4.1 Retail Overview 4.2 POS Shipment History 4.3 POS Installed Base History 5. INDIA 5.1 Retail Overview 5.2 POS Shipment History 5.3 POS Installed Base History 6. AUSTRALIA / NEW ZEALAND 6.1 Retail Overview 6.2 POS Shipment History 6.3 POS Installed Base History 7. SOUTH KOREA 7.1 Retail Overview 7.2 POS Shipment History 7.3 POS Installed Base History 8. VIETNAM 8.1 Retail Overview 8.2 POS Shipment History 8.3 POS Installed Base History 9. TAIWAN 9.1 Retail Overview 9.2 POS Shipment History 9.3 POS Installed Base History 10. HONG KONG 10.1 Retail Overview 10.2 POS Shipment History 10.3 POS Installed Base History 11. OTHER ASIA/PACIFIC 11.1 Retail Overview 11.2 POS Shipment History 11.3 POS Installed Base History 12. Summary Tables 12.1 POS Historical Shipments by Segment from 2019 – 2022 12.2 POS Historical Installed Base by Segment from 2019 – 2022 13. FORECASTS 12.1 Projected Shipments by Segment from 2022 – 2027 12.2 Projected Installed Base by Segment from 2022 – 2027 REFERENCES List of Tables/GraphsList of Figures Figure 1 Asia/Pacific POS Shipment History and Forecast Figure 2 Asia/Pacific POS Installed Base History and Forecast Figure 3 Japan POS Shipment History and Forecast Figure 4 Japan POS Installed Base History and Forecast Figure 5 Japan POS Terminal Shipments and Installed Base by Retail Segment Figure 6 China POS Shipment History and Forecast Figure 7 China POS Installed Base History and Forecast Figure 8 China POS Terminal Shipments and Installed Base by Retail Segment Figure 9 India POS Shipment History and Forecast Figure 10 India POS Installed Base History and Forecast Figure 11 India POS Terminal Shipments and Installed Base by Retail Segment Figure 12 Australia/New Zealand POS Shipment History and Forecast Figure 13 Australia/New Zealand POS Installed Base History and Forecast Figure 14 Australia/New Zealand POS Terminal Shipments and Installed Base by Retail Segment Figure 15 South Korea POS Shipment History and Forecast Figure 16 South Korea POS Installed Base History and Forecast Figure 17 South Korea POS Terminal Shipments and Installed Base by Retail Segment Figure 18 Vietnam POS Shipment History and Forecast Figure 19 Vietnam POS Installed Base History and Forecast Figure 20 Vietnam POS Terminal Shipments and Installed Base by Retail Segment Figure 21 Taiwan POS Shipment History and Forecast Figure 22 Taiwan POS Installed Base History and Forecast Figure 23 Taiwan POS Terminal Shipments and Installed Base by Retail Segment Figure 24 Hong Kong POS Shipment History and Forecast Figure 25 Hong Kong POS Installed Base History and Forecast Figure 26 Hong Kong POS Terminal Shipments and Installed Base by Retail Segment Figure 27 Other Asia/Pacific POS Shipment History and Forecast Figure 28 Other Asia/Pacific POS Installed Base History and Forecast Figure 29 Other Asia/Pacific POS Terminal Shipments and Installed Base by Retail Segment Figure 30 2022 – 2027 Asia/Pacific Projected Shipments by Retail Segment Figure 31 2022 – 2027 Asia/Pacific Projected Installed Base by Retail Segment
ご注文は、お電話またはWEBから承ります。お見積もりの作成もお気軽にご相談ください。本レポートと同分野(店舗)の最新刊レポート
IHL Group社の POS/セルフサービスハードウェア分野 での最新刊レポート本レポートと同じKEY WORD(pos)の最新刊レポートよくあるご質問IHL Group社はどのような調査会社ですか?IHLグループ (IHL Group) は、米国テネシー州に本社をおき、世界の小売業とサービス業向けのIT技術を専門に調査しています。 もっと見る 調査レポートの納品までの日数はどの程度ですか?在庫のあるものは速納となりますが、平均的には 3-4日と見て下さい。
注文の手続きはどのようになっていますか?1)お客様からの御問い合わせをいただきます。
お支払方法の方法はどのようになっていますか?納品と同時にデータリソース社よりお客様へ請求書(必要に応じて納品書も)を発送いたします。
データリソース社はどのような会社ですか?当社は、世界各国の主要調査会社・レポート出版社と提携し、世界各国の市場調査レポートや技術動向レポートなどを日本国内の企業・公官庁及び教育研究機関に提供しております。
|
|


